Category: NBA


  • Klay Thompson | 2019 Valuation

    Klay Thompson | 2019 Valuation

    (? The Ringer)

    Praised for his two-way play and world-class marksmanship, Klay Thompson was often drowned out in a sea of offensive stars in Golden State. Despite five consecutive All-Star appearances, he was the Warriors’ third option on offense. Thompson’s status as a tertiary offensive weapon hindered the recognition he would receive, but the development of title odds metrics have demonstrated the importance of second-and-third stars. Today, I’ll tackle questions like the true value of Thompson’s offense and defense to estimate the overarching principle of my player evaluations: what are the percent odds Klay Thompson wins a title on a random team?

    Scoring

    Despite a limited involvement in Golden State’s offense (offensive load ~ 33%), Thompson was one of the league’s most effective scorers. He provided strong options in the three main regions of scoring: the post, the midrange, and the perimeter. Thompson was successful on 72% of his attempts from within three feet of the hoop and didn’t shoot lower than 42% from any of Basketball-Reference‘s primary shooting ranges. He had a moderate dip in three-point efficiency compared to his previous seasons: 40.2% in 2019 down from 44% the season before, the main factor in Thompson’s declined overall efficiency (-2.8 rTS% from 2018). However, this was mainly a product of early-season struggles; Thompson raised his three-point efficiency to 44% in the Playoffs.

    As the lethal shooter he is, Thompson thrives on step-back opportunities. He doesn’t maneuver the way most elite step-back shooters do, like Luka Dončić or James Harden. Thompson’s movement is largely directed from one baseline to the other, a vertical motion rather than horizontal. He’ll often be running toward the hoop with the ball in his hands and quickly shift his momentum backward, snapping a shot multiple feet behind his defender. This unorthodox path of movement also makes Thompson a great driver. Aided by his 6’7″ frame, exceptional for a guard, Thompson is a solid post-up option to keep up with larger wings. Although a hesitant dribbler at times, Thompson would function as an adequate secondary or tertiary pick-and-roll ball-handler. His ability to exploit a defense’s horizontal spacing, the spacing between two staggered defenders, opens up the corners for shooters and either side as a driving lane for the roller.

    Thompson was one of the league’s greatest tertiary scorers in the league, averaging 22.6 points per 75 possessions on +1.4 relative True Shooting. The latter measurement is not the most indicative figure of Thompson’s efficiency as we examined earlier. In the Playoffs, he rose to +1.9% in the efficiency department, still an underwhelming figure. However, considering his two-point efficiency dropped 5.4% in the Playoffs, it’s clear there are some confounding variables working against Thompson here. At an average strength, let alone full-strength, Thompson is still one of the league’s most efficient shooters and scorers. According to Backpicks‘s ScoreVal metric, Thompson’s scoring added fewer than 0.5 points every 100 possessions. However, considering his aforementioned efficiency troubles, his actual value would most likely exceed that benchmark. Thompson’s high-volume, high-efficiency style paired with historical shooting makes him an elite scoring option in Golden State’s offense.

    Playmaking

    Thompson never has, and likely never will be an above-average creator and passer. His limitations are very clear, especially in the half-court. Thompson will pick up his dribble and be forced to make a close pass near a block, and in those spots, he displays some concerning accuracy. We’ve seen this during the entirety of the 2019 season: Thompson struggling to generate efficiency half-court offense with his passing. Throughout his career, Thompson has never had a Passer Rating less than 4.2 or greater than 5.1, perhaps a mild overstatement, but the measurement largely captures the quality of his passing. Thompson is also an unimpressive creator. Defenders would often leave Thompson often despite his presence on the perimeter. However, it’s fairly clear and worth noting that those defenses had more trouble than usual: Curry and Durant. As a result, I’m willing to state Thompson’s “true” creation is understated by his situation. He’s created around 4 to 4.5 shots per 100 in the last four seasons.

    As a member of the Warriors, Thompson has provided neutral to slight-negative value as a playmaker. Backpicks‘s PlayVal estimates Thompson’s point-contribution as a playmaker has been below zero since the 2016 season. However, as we examined earlier, this is in large part a product of Thompson’s situation. If he were in a neutral setting, Thompson would likely be neutral to a slight-positive playmaker. The quality of his passing, a characteristic that isn’t affected by situation, hinders Thompson from “good” playmaking status. His creation would likely improve alongside more typical teammates with an increased role as a ball-handler and a larger threat to defenses, and as a result, I’d label Thompson as a “neutral” playmaker in 2019.

    Off-Ball

    Similar to his two previous skills, Thompson’s off-ball value is overshadowed by the likes of teammate, Stephen Curry: one of the greatest off-ball scorers of all-time. Thompson displays his own fair share of calculating movement. Contrary to Curry’s arsenal of screening action and quick darts across the court, Thompson relies on his lateral movement. His strong hips that aid him as a man defender allow him to quickly change direction and faze defenders. Resultantly, Thompson will often find himself an open look at the perimeter, where his more enveloped role in Golden State will provide Thompson with an open shot. He also separates himself from Curry with his off-ball value in the post. Thompson is far more likely to be seen camping out by or cutting through the baseline, locating post-up opportunities, and funneling through as an offensive rebounding option. Thompson’s value off the ball adds to his elite scalability and impact as an offensive player.

    Defense

    Thompson fills a much-needed role in Golden State as the defender of the opposing team’s best offensive perimeter player. His aforementioned size plays a key role in Thompson’s containment of the league’s premier offensive stars. He’ll often match drivers in a running motion rather than a display of lateral movement, as we saw in his offense. This quick movement and swivels of the hips allow Thompson to keep up with faster guards approaching the paint. At times, Thompson will even stagger the penetrator before the latter can pass the charity stripe. His value as a team defender is far less apparent, but there are a number of positives accredited to Thompson’s name. As a taller guard, he can protect almost every spot on the court, as we see when he shuffles to the interior from up top to protect the paint from rolling forwards. As a result, Thompson is a very solid paint presence. With minimal errors in his defense, the only noteworthy ones being the mild tendency to ball-watch on coverages and some low-recognition plays, Thompson is a large positive on defense as a guard.

    Summary

    Contrary to popular opinion, impact metrics paint a very poor picture of Thompson’s value. His lower scores in the 2019 season include a PIPM of +0.26, a RAPTOR of +0.14, and a three-year luck-adjusted RAPM of +0.96. Then there are extremities like his -0.3 in Basketball-Reference‘s BPM and a -0.33 RPM. However, it’s worth noting impact metrics (except RAPM) are calculated with 1) the box score and 2) luck-adjusted on-off ratings. Thompson doesn’t exactly fill the stat sheet with assists, rebounds, steals, and blocks, and he’s gotten the shorter end of the stick in on-off totals. Golden State’s defense was 4.4 points more efficient with him off the floor and their offense was only a point-and-a-half better with him on the floor. Prorating these scores to a “neutral” environment and examining his impact across a variety of settings, I’d estimate Klay Thompson provides a random team with an increment of 9.13% odds to win a title at full-health.


  • Top 10 NBA Players of 2020

    Top 10 NBA Players of 2020

    (Cryptbeam)

    Ladies and gentlemen: it’s officially the most wonderful time of the year. Not because of Christmas, of course, but because it’s an ideal time to evaluate the league’s best players. With the Lakers’ game-six victory against the Heat closing the book on the 2020 season, now is the perfect time to reflect on basketball’s top talents; and what better way than with a top-10 list?


    Rationale

    This list intends to connect a player’s worth to a team’s ultimate goal – to win a championship. Therefore, the “best” players bring a team closest to a title. However, this isn’t a measurement of situational value, or how valuable a player is in his specific role on his specific team. I’ll look to connect a player’s “true” value, or how he’d impact a wide variety of teams, with increments in title odds. Resultantly, the placements on this list are partial to a trio of “portable” skills, or certain attributes that maintain value alongside better teammates: defense, passing, and shooting. The qualities of my criterion are similar to those of the CORP methodology because of a shared common goal: to, as stated earlier, connect a player’s value across a variety of environments to the degree of championship lift he provides.

    (Click here for a deeper review of my methodology)

    Disclaimer: This ranking does not assume all players are healthy. For example, if a player misses 2 of his team’s 10 postseason games, that player is credited with 80% of his full-heath championship equity in the Playoffs.


    10. Damian Lillard

    Lillard vaulted himself into the conversation as one of the league’s greatest offensive players this year. His lethal scoring repertoire, which consists of elite screen action, defensive spacing exploitation, and perimeter play resulted in an impressive 28.5 points per 75 on nearly +6.5 relative True Shooting. Lillard’s instrumental playmaking was a large asset for Portland, creating around 15 extra shots for teammates every 100 possessions. He doesn’t provide a ton of value off the ball, and Lillard’s postseason offense was clearly inferior to his regular-season self. Lillard’s defense is also problematic. His deep coverage and transition efforts make it hard to argue he’s a positive on that end, but the general premise of Lillard’s offense earns him a spot on this year’s list.

    9. Jimmy Butler

    Butler’s postseason play was the deciding factor in his spot on this year’s top-10. He maintained a decent scoring attack of 22 points per 75 on moderate efficiency in the regular season, but the latter’s Playoff changes were an influential factor in Miami’s Finals run. Butler improved by nearly five percentage points in the True Shooting department, enough to make his Playoff scoring elite. His facilitation drastically improved once separate from a drowned-out role in Philadelphia. Butler improved by four extra shots in the creation department, a figure he maintained in the second season. Butler’s great defensive impact, a mixture of low-error play, good positioning, and strong hands are of high worth to NBA rosters. His anchoring of a great postseason offense and perennially-strong defense made him a newcomer in my latest top-10 list.

    8. Nikola Jokić

    Jokić was nearly identical to his previous-season self: identical scoring and (adjusted) turnover rates and slightly higher efficiency and creation. Similarly, his 23.6 points per 75 and +3.7 rTS% in the regular season rose to 25.8 and +5.5 in the Playoffs, respectively. Jokić’s postseason change was on perfect display with his three-point efficiency, which vaulted to 43% on 5.4 attempts per 75. He continued his highly-effective “bully-ball” and perfected his pick-and-roll routine with teammate Jamal Murray. Jokić’s defensive remains the subject of criticism; his honey-bear build and slow feet don’t amplify his team’s defense. However, his quick reaction time and smart hand placements keep Jokić’s head above water in terms of defensive impact. Jokić’s role as a strong offensive cornerstone is applicable to a wide variety of teams, which paired with adequate defensive impact, makes Jokić one of the most equitable players in the league today.

    7. Luka Dončić

    Luka Dončić, in a season in which he was surely robbed of the MIP Award, took his offensive game to another level. Dallas featured the most efficient offense in league history, posting a 117 Offensive Rating in the regular season. Dončić’s having anchored that offense is a strong indicator of how good his offense is. He was near the top of the league in scoring rate, 31.1 points per 75, which he matched in the postseason, on stronger efficiency against a tough Clippers defense. Dončić was the true centerpiece of his team’s offense; he was “meaningfully” involved in roughly two-thirds of his team’s possessions. His offensive attacks, step-back jump shots, foul-drawing, and tough-shot making contribute to his world-class offense among a plethora of on-ball habits. Dončić’s defense is nothing to be impressed with: mediocre positioning, man, and off-ball defense, but his offense is enough to propel him safely onto this year’s list.

    6. Joel Embiid

    Embiid was quietly one of the league’s top players this season. He had a strong season as a scorer: 28.4 points per 75 on +2.1 relative True Shooting, which grew to 31.9 and +3.9 in the postseason, respectively. Embiid is a strong bully in the post with solid feet under the right care, which paired with undervalued passing and creation, makes him a strong offensive anchor in the post. However, the aspect of Embiid’s game that separates him from the players ranked below him is his defense. Embiid is antithetical to Butler in that his defense is more prone to error, but the benefits are of far greater return. He’s an extremely strong paint presence (career 4.8 block percentage) with solid pass anticipation, which paired with his maintained value in the Playoffs, sets Embiid apart from the rest of the pack. His strong post offense and world-class defensive impact are deciding factors in Embiid’s placement.

    5. James Harden

    James Harden continued his trend as one of the league’s elite offensive weapons in 2020. After posting the highest scoring rate in league history in 2019, Harden remained near the top of the leaderboards at 33.2 points per 75 possessions on high efficiency. In the Playoffs, his volume dropped to 29.3 points per 75, but his increased efficiency argues Harden had his best-scoring season in the Playoffs this year. His creation rates were consistent with the league’s top marks, exceeding 15 shots created per 100 in the regular season and 12 per 100 in the postseason. If Harden’s offense were more scalable or he provided more off-ball value, he would ubiquitously rank as the league’s top offensive player. However, given the “true” value of his offense and subpar defensive efforts, Harden comes in at fifth this year.

    4. Kawhi Leonard

    Leonard had one of his strongest regular seasons in 2020. He entered the upper echelons of scoring at 30.4 points per 75 on respectable efficiency. Leonard’s creation made a clear leap from last season, rounded at 11 shots created per 100. There were still instances of hesitance on Leonard’s passes, and it’s likely his playmaking estimates are a tad overrated, but his distinct improvements on that front gained him some offensive territory. Leonard’s defensive impact will likely never match his defensive talent as the two did earlier in his career, but Leonard remained one of the league’s top wing defenders in a mix of excellent hands, a prominent ability to clog passing lanes, and solid tracking on the perimeter. Leonard’s weaker profile in the postseason and limitations as an offensive engine diminish his ceiling on this list, but the totality of his championship equity ranks him near the top of the league this year.

    3. Giannis Antetokounmpo

    The Greek Freak had one of the greatest regular seasons of all-time according to the sport’s major impact metrics. Antetokounmpo led the league in RAPM, RPM, PIPM, and three BPM statistics (Basketball-Reference‘s, Backpicks‘s, and my own models). He led the league in scoring rate, 33.3 points per 75, on impressive efficiency, +5.2 relative True Shooting. The Greek Freak’s creation rates were approaching the top of the league, but similar to Kawhi Leonard, his hesitance to make tougher passes leads me to believe those figures are moderately overstated. His postseason dips aren’t close to remotely as dramatic as the average commentator will state: 31 points per 75 on +4 rTS% with similar creation rates. Antetokounmpo nearly doubled his relative offensive rebounding rate despite facing two of the league’s most prolific defensive-rebounding teams in Miami and Orlando. His absence in Game 5 of the Eastern Conference semis takes him down a notch on this list, but Antetokounmpo’s historical 2020 will remain a footnote in basketball history.

    2. Anthony Davis

    Anthony Davis makes arguably the strongest case as the league’s best frontcourt player of the season. His already elite box profile of 27 points per 75, 61 TS%, ~ 5 Box Creation, and +2.4 rORB% in the regular season leaped to 29.5, 66.5, ~ 6, and +2.9 in the postseason. Davis’s offensive profile is a great fit on strong offensive teams: strong scoring and efficiency as well as undervalued passing. Contrary to Giannis Antetokounmpo’s evaluation, Davis is a high-quality passer with lower creation rates. Davis’s shooting in the Playoffs (38% from 3) and improved play were focal points of the Lakers’ title run. However, the strongest facet of Davis’s résumé is his defense, a lethal mixture of awareness, great hands, positioning, and multidimensional coverage. His strong combo of offense and defense was good enough to blur the title of “best player” on the Lakers roster. Davis’s strong two-way play, especially in the postseason, propelled him to the second spot on this year’s list.

    1. LeBron James

    LeBron James refuses to age for another year as he contributes more championship equity than any player in the league once again. His impressive scoring repertoire as a strong driver and passable shooter, when paired with historical passing, makes James arguably the best offensive player of the year. He thrived as a primary ball-handler up top, skipping passes all over the court and converting on near-impossible chances. James’s value off the ball wasn’t as excellent, but his transferrable role as an offensive centerpiece is a strong point of his résumé. Contrary to 2019, James was a strong positive on the defensive end. His elite anticipatory movement, positioning, and rim protection contributed to a highly-valued defensive role in Los Angeles. James continued his career trend of improvement in the postseason, the deciding factor in his topping this year’s list. 


    I’ll defend my positions on these players, but there will always be some wiggle room in these rankings. The order in which the players appear on this list is not definitive, and a certain degree of shuffling wouldn’t drastically alter the results. With that, I’ll close the book on my top-10 players of 2020 player ranking. Now that we’ve cycled through another year of NBA basketball, I’m curious to read your guys’ top-10 lists. ⬇️⬇️ 


  • The Modeling and Principles of “Championship Probability Added”

    The Modeling and Principles of “Championship Probability Added”

    (? Medium)

    ForbesSports IllustratedBleacher ReportThe Washington Post, and ESPN. Five varying and mostly unrelated platforms. What do they have in common? In the past year, they’ve each taken a crack at composing a list ranking the NBA’s best active players. NBA commentators, critics, and fans are all acquainted with one or more of the aforementioned lists, each of which was followed with strong complaints. Instagram has a populous NBA community. The comment sections of related posts often feature two or more users lashing out at each other because of minor, negligible disagreements. If the league’s media has taught us anything, it’s that varying opinions can be the cause of severe conflicts, especially when it comes to ranking players.

    I’ve assembled my own lists over the years. The latest, which ranked the NBA’s top-10 players in the league, garnered strong criticism when sent to a focus group. My first and secondhand experiences with opinion-based conflicts led me to explicitly record the “methodology” of my player rankings. This article is also meant to accompany an upcoming list that ranks the top-10 players of 2020 to paint a clear and more detailed picture as to why certain players appear where they do. Based on an accumulation of theory, evaluation, and statistical modeling, here is the process that creates my player ranking lists.


    Framework

    Before composing a player ranking, I need to have an overarching ideology: a framework as to what constitutes the league’s “best” or “greatest” players. My attempt at forming a local structure to answer this question goes as follows: 1) a player is rostered with the hopes of improving the success of his/her team, a notion I believe most of us will agree on. 2) Teams possess the ultimate goal to win a championship, another notion I believe most of us will agree on. Therefore, the “best” and the “greatest” players bring teams closest to that goal: the primal ideology employed in my player-ranking lists.

    Similar criteria can be found in the CORP valuations at Backpicks, a measurement that introduced two key concepts I also use in my own rankings, the first being “portability.” Portability, also known as “scalability,” refers to how well a player’s situational value is held alongside better and better teammates. One way to think about this idea is to imagine James Harden, the recipient of the last three scoring titles, rostered alongside the likes of Giannis Antetokounmpo, Stephen Curry, Kevin Durant, LeBron James, and a heap of other NBA superstars. Would James Harden still score 30 points a night, or would his high-volume scoring be drowned out in the plethora of high-octane scorers alongside him?

    To differentiate between high and low-portability players, I’m partial to 1) a group of skills that Backpicks laid out in the site’s own post of similar nature and 2) historical observations of how a player changes from team-to-team. The following graphic serves to show the site’s definitions of skills and how they relate to scalability.

    Backpicks

    Evidently, the most “scalable” offensive skills per the legend are spacing, passing, and finishing (efficiency). Therefore, the sport’s more portable players typically display proficiency in the preceding skills. However, high-portability players aren’t exclusively defined as stated earlier. If a player shows the ability to maintain situational value on greater teams, regardless of “how,” it’s an example of high scalability. Stephen Curry is a great example relating to the former, skill-based definition of portability. He spaces the floor as well as any player in league history, displays excellence as a quality passer, and remains one of the sport’s most efficient scorers. Draymond Green is a great example relating to the latter, observation-based definition. He’s not a great spacer nor a superbly-efficient scorer, but his situational value took minor hits after the additions of multiple All-Stars to the Warriors’ roster. 

    What’s the significance of portability? It provides an optimal solution to a question of importance to me: how a player changes in different situations. As scalability was created for, a key aspect of a player’s championship equity is how that player impacts teams of varying quality. This is contrary to the conventional form of solely considering a player’s situational value, or how he impacts his single team: a single situation. My evaluations consider a player’s value on a wide range of teams, further gauging my definition of a player’s “true” value. If you were to watch the annual Thinking Basketball top-10 lists, you’d encounter the same overarching question I consider in my evaluations: which players give a random team to best odds to win a title?


    CPA Valuations

    To answer the proposed question, to determine which players provide the most championship lift across a variety of environments, I conduct player valuations at the end of a season. To gauge a player’s championship equity, I consider:

    • Film studies: random-sampling segments of a player’s games across the entirety of a season, targeting performances against varying qualities of opposing offense and defenses. This is the most useful step in understanding a player’s role on his team, information that is key for later steps.
    • Statistical profiles: quantifying a player’s actions on the court. Box scores and play-by-play data alone tell absolutely nothing about how good a player truly is, rather these profiles are an additional step in further understanding a player.
    • Impact metrics: in theory, the most important measurement tools we have. However, they only capture a player’s value on his own team; they’re measures of situational value. Comparing a player’s scores helps understand how different information (box score vs. on-off, etc.) measure s a player.
    • Numerical conversions: conforming a player’s “Regularized Adjusted Plus/Minus” (RAPM) to a neutral environment, i.e. an “average” team. That number is then plugged into a calculator that considers portability and health to estimate a player’s championship equity.

    The resulting measurement is denoted as a player’s “CPA,” or “Championship Probability Added.” Inspired by the aforementioned CORP metric, CPA measures the percent odds a player wins a title on a random team. The components of the “calculator” are based on fifty years of team data and theory to measure a player’s value. At this point in my player valuations, the fat lady starts to sing.


  • Identifying the Main Deficiency of “Moreyball”

    Identifying the Main Deficiency of “Moreyball”

    (Picture courtesy of The Ringer)

    Despite sporting one of the greatest offensive forces in league history, the Houston Rockets have repeatedly failed to win a title. It drew claims that James Harden’s style of play, an emphasis on ball-pounding and isolation scoring, couldn’t win a team a title and that Daryl Morey’s analytical approaches were futile. Let’s take a look at each of the past six iterations of the Rockets to map a general arc of the team’s performances in Harden’s superstar reign.

    • 2015: +3.8 SRS (#7) | WCF loss
    • 2016: +0.3 SRS (#15) | First round loss
    • 2017: +5.8 SRS (#3) | Semifinal loss
    • 2018: +8.2 SRS (#1) | WCF loss
    • 2019: +5.0 SRS (#5) | Semifinal loss
    • 2020: +3.1 SRS (#7) | Semifinal loss

    In the last six years, the Rockets have rarely underperformed in the Playoffs considering their regular-season proficiency. As the #7 team in the NBA in 2015, they managed to make the Conference Finals, a berth (in theory) saved for top-four teams. Houston’s sudden drop in 2016 and a first-round exit line up perfectly. 2017 and 2018 were the two seasons in which the Rockets’ face value didn’t live up to par in the second season. In factoring the landscape of the Western Conference that year, there were two teams better than Houston – Golden State and San Antonio – the eventual Conference Finals matchup. 2018 was anomalous; the Rockets were the best regular-season team in the West by a large margin, yet lost in the Conference Finals. Why?

    The series went to seven games, a back-and-forth battle in which neither team gained solid ground until the very end. Employing a certain rationale, the “luck factors,” the Rockets “should have” won the series. Houston rostered a top-ten level Chris Paul (+5.0 RAPM, #3 in the league) whose absence in Game 7 wavered the playing field, although it might not have been enough to overcome the nine-point deficit. Introduce the “27 consecutive missed three-point attempts.” Golden State was a good defensive team that season (#11 in DRtg), but not good enough to not chalk Houston’s shooting woes to detrimental luck. As a team, the Rockets posted an abysmal 43.9 eFG% in Game 7, a 5.7% decrease relative to their series average. As we examined in my Bucks/Raptors study last month, teams that experience massive drops in efficiency underperform in the Playoffs; and among Dean Oliver’s offensive four factors, efficiency is by-far-and-beyond the most important and indicative. 

    However, if we examine the aggregate of the series, Golden State outscored Houston by 9.6 points every 100 possessions, a retrospective expectation of 77% odds to win the series. In theory, the Warriors “should have” won the series in a mere five games. Therefore, we can identify good and poor luck on Houston’s behalf and conclude they deservedly lost the series. Considering the closeness of the series in series length and Houston’s poor luck, it’s also reasonable to suggest Morey constructed a true championship team. It’s the difference between absolute and situational luck; the Rockets had poor luck in the latter bisection. If they’d gotten the upper hand in injury and/or only 9% of their shooting luck, Houston would’ve advanced to the Finals; and considering the extremely weak Cleveland Cavaliers in the 2018 Finals, the Rockets would’ve been the clear favorites, and therefore “could have” won a title.

    It’s important to examine Houston’s past, factoring in context to consider absolute and situational lucks, to understand the team’s successes or failures attributed to Morey. Due to the information we drew in the overview of the 2018 Western Conference Finals, Morey does deserve compensation for assembling a championship team. As a general manager, he’d essentially constructed a title team; the poor luck he couldn’t prohibit diminished the actual outcome. Therefore, the “knocks” against an analytically-driven perspective were mostly unfounded, although Morey’s tenure as a GM has also had an inverse of large question marks, which precedes the question: So why do the Rockets continue to fail? Morey’s decisions in the office have shown to be great as well as… not so great. I’ll take two of Houston’s trades in the last three years to examine this dichotomy and how they eventually dictated the team’s track record in the Playoffs.

    Chris Paul to the Houston Rockets

    • Houston receives: Chris Paul
    • LA receives: Patrick Beverley, Sam Dekker, Montrezl Harrell, Lou Williams, and 2018 FRP

    The acquisition of Chris Paul was an ingenious transaction on Morey’s behalf. It was the nail in the coffin for his construction of a championship team. However, the trade received retrospective criticisms due to the rise of Beverley, Harrell, and Williams with the Clippers, but I’d argue both teams “won” the deal. Morey chose to pair Paul with Harden, and here I’ll introduce a key principle of today’s introspection: portability. Portability explains how different players’ situational value, or the contributions a player makes in certain situations, scales alongside great teammates. Philosophically, it makes sense a +5 player doesn’t automatically transform a +8 team to a +13 team. Firstly, there’s never been a +13 team in league history, and we’ve seen an even-more profound scenario unfold to support portability. In 2016, Kevin Durant ( > +5 player) joined the Warriors (+10 team) and – ignoring the lineup continuity of that team – improved them to a +11 squad. This isn’t to say Durant was a +1 player, rather his – and all great players’ – impacts diminish alongside better teammates. 

    Applying this principle to Harden, we can deduce he was (and still is) not a high-portability player. His shooting and passing, the two most “scalable” offensive skills, are adequate from the skill-only perspective; however, upon deeper examination, Harden’s originally positive portability in 2014 has decreased. He’s historically in the 99th percentile in seconds per touch, a measurement of how long the ball remains in a player’s hands every time he receives it. Harden’s ball-dominance and isolation-heavy scoring, aside from acting as a Harden cliché, is one of the less portable skillsets in the NBA. We saw this during Paul’s first season in which his contributions took a significant dip. (For context, Paul is a neutral-portability player.) He was equally involved in the offense as he was in his previous season with the Clippers (|0.1| difference in USG% / |3.9| difference in offensive load) but experienced reductions in efficiency (-2 TS+), free-throw rate (-5.4 FTr), creation (-2 opportunities created), passing quality (-1.2 Passer Rating), and playmaking value (-0.8 PlayVal). Players of Harden’s likeness are bonafide megastars… who come with a price: radically diminishing the efforts of teammates.

    Russell Westbrook to the Houston Rockets

    • Houston receives: Russell Westbrook
    • Oklahoma City receives: Chris Paul, FRPs in 2024 and 2026, FRP swaps in 2021 and 2025

    With the information we have now, Oklahoma City “fleeced” Houston in this trade. Houston left go of two first-round draft picks (1-4 protected) and acquired a point guard of equal or greater equity to Westbrook. More importantly, Houston’s fatal flaw was an inability to recognize portability. Before the trade went through, Westbrook clocked in as the least-portable player among measured players in the 2019 season. The increased struggles to mesh Westbrook with other star players had already been apparent (his historic MVP season fell to borderline All-NBA considerations a season later), yet Houston chose to pair him with Harden. Critics who pointed out the pairing of two of basketball’s ball-dominant stars as a poor decision were correct, as of now. Houston had a -1.9 drop in SRS with an average roster continuity (65%). More surprisingly, though, is how Westbrook’s situational value massively decline with the Rockets. His game-scaled APM value hovered around +3 in 2019; however, in 2020, that number (per Ryan Davis’s RAPM) has dropped below +0.7. Houston’s micro-ball lineup is tailored to support players with competent distance scoring, a skill at which Westbrook is arguably the worst among active players. 

    Near the end of the Rockets’ season this year, Westbrook provided nearly no situational value in Houston. If he were on an average – or even a random team – Westbrook’s situational value would skyrocket; his fit with the Rockets is simply detrimental to his role on that team. For example, a season after posting a Passer Rating ~ 8.0, that value dropped to a tick over 5.5. None is this is to say Westbrook was worth nothing to the Rockets; Backpicks estimates Houston improved by ~1.5 points per 100 with Westbrook on the floor. It’s also worth noting that the Rockets are by no means a bad team. They were still the #4 team in the West with both a good offense and a good defense. However, Westbrook’s low-portability and inconsistencies with the micro-ball scheme may hold the team back. To understand the other half of this phenomenon, we have to observe Chris Paul in his new environment as well. His successes or failures in Oklahoma City dictate a broader perspective to Harden’s portability and his tendency to diminish teammates.

    To understand Paul’s performance with the Thunder, a key principle of portability needs a refresher. Low-portability players don’t necessarily diminish the efforts of their teammates nor lower their situational value alongside better teammates; it’s one or the other. Take Harden: his play has remained stagnant (or even improved) in each of the past six-or-so seasons. He’s an example of a player whose efforts remain similar while diminishing the efforts of his teammates, i.e. Russell Westbrook. Westbrook has played alongside historic iterations of Kevin Durant and even 2019 Paul George. However, during those seasons, Westbrook’s own contributions decreased. He’s the example of a player whose efforts tend to diminish while his greater teammates keep their value. With that in mind, let’s take a look at Paul. Paul drastically improved in OKC after an injury-riddled 2019, cracking the #8 spot on my “Top 10 Players of the 2020 Season” list. He experienced leaps in scoring volume, efficiency, scoring and playmaking value, creation, passing, turnover rate; take your pick of skills. Paul converted on more than 50% from mid-range and over 75% at the rim en route to a reviving 2020 campaign. Between Paul and Westbrook, the latter having been significantly valued over the former in their swapping, Paul is – as stated earlier – perhaps equal to or greater than Westbrook in terms of isolated value. 

    So why do the Rockets continue to fail? Morey has a history of pairing low-portability stars, the product of which results in lesser forms of either star (take Harden and Westbrook, for example). In contrast, the Golden State Warriors of the late 2010s assembled the high-portability stars of the NBA. Last season, the only three players to register an offensive portability score greater than one were Stephen Curry, Draymond Green, and Klay Thompson. Teammate Kevin Durant tied as the league’s fourth-most portable player. Rostering four of the most scalable players in the league created one of the greatest dynasties in league history, the opposite of which Houston has managed. For the Houston Rockets – for “Moreyball” – to truly explode onto the scene, the front office is safer to incorporate players whose skills scale up alongside great teammates, rather than the opposite. The implementation of smarter, more grounded analytical principles could be the key to a championship in Houston.


  • Top 10 Seasons of Kobe Bryant’s Career

    Top 10 Seasons of Kobe Bryant’s Career

    (Picture courtesy of The Ringer)

    Kobe Bryant’s iconic career was littered with All-NBA seasons, the aggregate of which created one of the greatest off-guards in league history. Today, I’ll try to arrange the “greater” half of Bryant’s career in order of how good he was in a given season. Namely, if Bryant were plopped on a random team, how far would the squad advance? It’s my attempt to measure a player in a vacuum, inspired by the “CORP” methodology, to draw out the greatest stints of Bryant’s career.

    10. 2004-05

    Nearing the middle of the decade, Bryant had a typical (to his standards) season. His scoring was at an expected volume (26.8 points per 75) on great efficiency (+3.4 rTS%) considering the effect of diminishing returns that comes along with 26 FGA/100. Bryant created more than nine shots per 100 that year, a new career-high at the time, a spur in his improving passing profile. He also saw a jump in adjusted turnover rate (cTOV%), perhaps due to an increment in offensive load from the previous season. Bryant anchored a good offense (+2.o rORtg) but a poor defense (+5.3 rDRtg), resulting in a relatively poor Lakers squad (-2.3 SRS). Bryant’s impact was moderately diminished from the previous season; his game-scaled APM dropped a full point to slide in as a +1 player for the season.

    9. 2003-04

    Although a good season relative to the rest of the league, Bryant’s play mildly decreased after his third title with the Lakers. His scoring rate dropped 3.4 points per 75 (although his efficiency increased by +0.4 rTS%). Similarly, the volume of Bryant’s passing dropped (-2.6 differential in shots created) while the quality of his passing rose (+0.8 leap in Passer Rating). Bryant also further displayed his shaky three-point shooting (-6% differential in 3P Proficiency). His impact decreased by 1.5 points in Basketball-Reference‘s Box Plus/Minus model, but only 0.3 points in Backpicks‘s model. Bryant was roughly a +2 player in APM/g, a -0.3 differential from the previous season. He increased a random team’s title odds by ~ 12% per “CORP,” good for an “All-NBA First Team” type of season.

    8. 2001-02

    Kobe Bryant’s first full season in the 201st decade wasn’t a stepping stone for greater performances to come, but it was one of the more accomplished seasons of his career. His involvement was nearing a career-high, eclipsing the 45% mark in offensive load. Bryant’s massive leap in scoring volume was starting to stabilize, averaging 25.8 points per 75 that year. It was also his sixth consecutive season posting a TS% greater than league-average. Bryant’s season was an indicator of a surprise leap in passing starting to normalize; he was creating around seven shots every 100 with a Passer Rating close to 6. Bryant was a horrendous three-point shooter in 2002, converting on 25% of attempts and posting a mere 20% 3P Pro. It was his second season with a BBR and BP OBPM > 4, a signal toward his growing offensive ceiling. The ’02 Lakers were the third-best team Bryant played for in his career (7.2 SRS) and the fifth-best offense (+5.9 rORtg). He was worth ~ 3.5 points per 100 that season, the second-highest mark of his career at that point.

    7. 2009-10

    The first of Bryant’s seasons on the list to not take place in the early 2000s, his final full season of the 201st decade was one of the most impactful of his career. Bryant was a seasoned veteran, having just entered his 30s, but he hadn’t lost a step in terms of performance. He averaged nearly 27 points per 75, in line with his career-average, on slight-positive efficiency. Bryant was now creating eight shots for his teammates every 100 on a moderate passing quality. He didn’t fare as well in the box score as he did in previous seasons (~ 4.0 BP BPM and +4.1 BBR BPM), but it was his second-greatest season in terms of APM/g (~5.5), a mark Bryant didn’t eclipse in all but his greatest season ever. His defense was exceptionally strong for a guard (> 1 DAPM/g) and fared well in Backpicks‘s box score/plus-minus hybrid “AuPM” (~ 4.0 per game). Bryant’s team took a dip in quality from the previous season (-2.3 SRS differential), but the Black Mamba himself was right on par with all-time greats.

    6. 2000-01

    Bryant’s 2001 campaign was special in that it was the season in which he established himself as a star in the NBA. His scoring jumped from 22.5 to 28.5 points per game (intuitively crossing the threshold as an elite volume scorer), a +4.6 increment in “per 75” terms. Bryant’s efficiency in rTS% increased by more than a point, a testament to his ability to avoid diminishing returns on higher shot frequency (+4.5 more FGA/100 than the previous season). He created more than seven shots per 100 for the first time in his career and matched his career-high in Passer Rating. Bryant also posted a career-low in cTOV%, a surprising mark considering his increased load (+6.5 from the previous season). Bryant continued to struggle from long range (29% 3P Pro), but it made a little-to-no effect on his offensive prowess; he exceeded the +4.0 mark in BP OBPM and BBR BPM. His increased offensive load did take a toll on the defensive end in the box score (-1.8 BP DBPM differential and a -1.9 BBR DBPM differential), although his DAPM/g actually increased by +1.8 points. It was Bryant’s first season providing random title odds greater than 15%, and his first stint in the NBA as a superstar.

    5. 2008-09

    Bryant’s ’09 campaign was crucial in cementing his longevity. His listed age for the season was 30, an important footstep in a player’s career. It was a strong indicator of whether Bryant’s game would remain linear past his physical prime. He was still a ridiculous volume scorer, averaging 28.4 points per 75 possessions on +1.7 rTS%. Bryant’s offensive load was also similarly high; he was meaningfully involved in ~ 49% of plays and attempted slightly under 30 FGA/100. His shot creation remained similar, creating around nine shots per 100 with passing quality alike his norm. Bryant was turning the ball over at a very low rate; his cTOV% was just over 7% that year. He contributed more than a point every 100 from scoring and playmaking each (an intuitively marginal feat, but actually quite impressive). Bryant’s offensive wasn’t losing any ground; he was worth +5.9 points per 100 on offense per BBR BPM and nearly +4 per 100 in BP BPM. Bryant’s totality was worth more than +5.0 points per game in APM, and it reflected in his team’s proficiency (7.1 SRS in 2009). If not a footnote of persistence in his career, Bryant’s age-30 season was historic: an increment of ~ 16% title odds.

    4. 2006-07

    Following a mind-boggling 35.4 points per game campaign, slight regression wasn’t unexpected, yet he maintained similar play. Bryant’s stellar 31.6 points per game prorate to 29.8 points per 75, which paired with a career-high +3.9 rTS%, makes for one of his greatest-scoring seasons. Bryant joined a rare club in exceeding an Offensive Load greater than 50 for the third time in a career. Resultantly, he created the second-most shots per 100 in his career at the time, sparking an eventual eight-season streak of a Passer Rating in the six-range. Bryant contributed the (tied for) second-most points per 100 from scoring during his career, as well as a tick under one point from playmaking. He exceeded career-highs in free-throw efficiency, converting on 87% of an absurd 12.6 FTA/100. Bryant was, once again, worth more than five points a game in scaled APM, having anchored a modest offense (+2.2 rORtg). His BBR BPM raised in the Playoffs, although Daniel Myers’s model is notoriously skewed toward high-load players (which fits the metric’s description but has garnered theoretical dispute). Backpicks‘s model saw a decrease in production for Bryant, which is the sole stain in an otherwise flawless ’07 campaign.

    3. 2002-03

    The year following the Lakers’ three-peat was a defining season in Bryant’s career, with eventually continuous trends unveiling themselves. His scoring was perennially great, averaging 28.2 points per 75 on +3.1 rTS%, a top-two scoring season of his career at that stage. It was Bryant’s first time contributing in more than half of his team’s offense, and consequently, the first season in which he contributed nine shots for his teammates ever 100. It was the foremost-passing version of Bryant at the time, and he maintained remarkably low turnover rates. 2003 was his point of origin for contributing a point or more every 100 from both scoring and playmaking. Resultantly, it was clear Bryant was nearing or in his prime, supported through his one-number metrics (+7.1 BBR BPM, ~ 5.5 BP BPM, ~ 2.0 AuPM/g, and ~ 3.5 APM/g). It was clear the Bryant/O’Neal Lakers were on the decline (-4.5 SRS differential from 2002 to 2003), but Bryant continued to thrive in his newfound prime.

    2. 2005-06

    The season in which Bryant won his first scoring title makes a strong case as his greatest individual season. Despite a heavy load of 3,277 minutes in 80 games played with an offensive load north of 56% (!), Bryant was the (tied-for) second-highest volume scorer in league history (34.2 points per 75). Factoring in the offensive struggles (relative to current times) of the mid-2000s, he averaged 35.4 inflation-adjusted points every 75. Bryant took on a new level of playmaking capabilities, creating ten shots for his teammates every 100. Regardless of his massive load, Bryant maintained a cTOV% of a tick over seven percent. He went to the free-throw line an eye-popping 13.2 times every 100 and converted on 85% of attempts. Bryant was an adequate outside scorer (35% 3P Pro) en route to lethal offensive impact (+7.4 BBR OBPM, ~ 4.5 BP OBPM, ~ 6.0 OAPM/g). He provided a random team with a near 19% increment in title odds and truly cemented his status as a legendary scoring weapon.

    1. 2007-08

    Bryant’s sole MVP season appears at the top of the list, and not because of the award itself. At face value, ’08 seemed a typical season to his standards. Bryant averaged 27.4 points per 75 on great efficiency (+3.6 rTS%). He created around nine shots every 100 with similar passing quality to the rest of his career (Bryant always seemed to have a Passer Rating in the six-range). He was a dual-threat offensive weapon, exceeding the one-point mark in scoring and playmaking, and extended his streak of > 10 FTA/100. Bryant was a modest three-point shooter, even to today’s standards (36% 3P Pro), crossing the threshold into solid outside efficiency. Basketball-Reference viewed Bryant as slightly less than his legendary ’06 season (+5.8 BPM), but Backpicks‘s model argued he was actually in his prime (~ 6.0 BPM). Bryant also had two important career-highs in AuPM/g (~ 3.5) and scaled APM/g (~ 6.0) while playing for the second-greatest team in his career (7.3 SRS). He was on top of the world in the ’08 season, and the list aims to reflect it.

    Several iterations of the Black Mamba were present in three different decades of play, each conveying a new story to the previous one. Bryant found countless sources of contributions, whether it be scoring, playmaking, shooting, or defense. The result was one of the greatest careers in league history. Today’s list aims to frame the individual versions of Bryant’s illustrious play.


  • And Then There Was One

    And Then There Was One

    The inevitability of an Eastern Conference Finals matchup between the Milwaukee Bucks and the Toronto Raptors is increasingly prevalent as the NBA Playoffs descend upon us. FiveThirtyEight‘s RAPTOR forecast is one of few projections in which the aforementioned series isn’t expected to occur; the model favors the Boston Celtics (it is worth noting the scrapped Elo forecast paints Toronto as the title favorites, although it’s reimplementation as a secondary forecast increases the noise surrounding it). Basketball-Reference recognizes Milwaukee and Toronto as the likely Eastern Conference Finals pairing. My own (unpolished) projection model paints Milwaukee as the conference favorites with Toronto as a steady second. The plethora of predictions, projections, and information to base them on strongly implies the likelihood of the potential series, and as a result, it’s a matchup worth examining.

    I issued a poll on Discuss TheGame, a sports social platform, in which users would vote for the team they predicted would win the Eastern Conference this season. Milwaukee maintains a relatively strong 57% of voting shares, followed by Toronto (39%), with the other 4% allocated among the remaining contenders in the Eastern Conference, like Boston and Philadelphia. It’s a seemingly valid representation of the perceived playing field, although the depths of these stances reveal a clearer picture. If one were to question the individuals, the result would be a strong following of Toronto. Despite the general advantage toward Milwaukee in the eyes of the people, Toronto gained a solid foundation of supporters on Discuss TheGame. It was the revelation of this, as someone who sees the Bucks as strongly advantageous, that prompted my writing of this article. Today, I’ll explain my reasoning toward the Milwaukee Bucks as the eventual sole remaining team in the Eastern Conference.

    To understand the deficiencies of Milwaukee in the team’s previous Playoff series against Toronto, we must take a trip into the past. More specifically, May 19th of 2019. 

    2019 Eastern Conference Finals

    Milwaukee, the foremost regular-season team of the year, was positioned to advance to the NBA Finals after the first two games of the series. The team was maintaining a stellar +31 cumulative point differential and required a mere two wins to conclude the series. It was the aforementioned date, May 19th, at which point Milwaukee’s season fell apart. Toronto proceeded to win four consecutive games en route to one of the largest upsets of the year. Milwaukee’s proficiency in the regular season begot the notion, for it was worse than the 50th percentile outcome. Examinations of the six Playoff games may draw out crucial information on how Milwaukee’s performance wavered, and how a potential matchup could end in the team’s favor. 

    Series Analysis

    I’ll use last year’s Eastern Conference Finals to estimate how the Bucks’ deficiencies affected the outcome of the series. To determine the “winning formula” for Milwaukee in the series, I’ll plot the correlation between several descriptive statistics and cumulative performance from the 2019 Eastern Conference Finals.

    Dean Oliver’s “Four Factors”

    Dean Oliver’s “Four Factors” are an assortment of descriptive statistics to model the offensive and defensive proficiencies of basketball teams. The measurements account for scoring efficiency (eFG%), limiting turnovers (TOV%), offensive rebounding (ORB%), and free-throw frequency (FTr). I’m taking note of the four factors due to a multiple linear regression I ran in which the factors were input values to estimate ORtg and DRtg for teams using regular-season data from the 1973-74 season to the 2019-20 season. The four factors were strongly predictive toward team offensive and defensive proficiency, posting adjusted Pearson correlations of 0.986 and 0.989, respectively. I duplicated the same process for Milwaukee in the 2019 Eastern Conference Finals, and the results were similarly promising.

    • 0.996 adjusted R^2 to predict Milwaukee’s rORtg
    • 0.982 adjusted R^2 to predict Milwaukee’s rDRtg

    Due to the strong correlation between the four factors and Milwaukee’s relative performance, as well as the aforementioned regression accounting for more than four decades, it’s likely Milwaukee’s scores in the four statistics during the Playoffs will play a large role in claiming a Finals berth. Next, I’ll account for Milwaukee’s changes from the regular season to the Playoffs by calculating the difference between the team’s four factors from the regular season to the second season.

    • 55.0 eFG% –> 49.1 (-5.9%)
    • 12.0 TOV% –> 10.4 (-1.6%)
    • 20.8 ORB% –> 23.1 (+2.3%)
    • 19.7 FTr –> 23.4 (+3.7%)

    Milwaukee’s alterations in the four factors don’t seem to align with expectations at a first glance. The team actually improved in three of the four statistics. However, there may exist a rational ground to explain this occurrence. During my aforementioned regression, I assigned weighted values to the factors, assuming I had 100 percentage points to allocate, to estimate the importance of the factors. Efficiency accounted for 67% of importance to the regression, making it the distinct leverage point toward offensive proficiency. Therefore, if Milwaukee aims to dethrone Toronto as Eastern champions, the most important aspect of the four factors the team needs to improve in is scoring efficiency. The differential in eFG% last year was significant, a near 6% drop. Part of the anomaly might’ve been Toronto’s excellent defense (-7.1 rDRtg in the series) as a result of “The Wall,” a crescent-shaped alignment of defenders in the paint to eliminate some of Giannis Antetokounmpo’s paint presence. 

    If Milwaukee is to minimize efficiency woes against Toronto in the Playoffs, the team would’ve likely displayed improvements in, specifically, eFG% from last season to now. Milwaukee posted a 55.0 eFG% in the 2019 regular season, the highest score in the Eastern Conference. The team did improve on last season’s score, finishing the 2020 regular season with a 55.2 eFG%. It’s an improvement, although, at a first glance, it may not be enough to overcome the original drop-off in scoring efficiency. Milwaukee’s offense actually regressed in the past year; the team’s ORtg/A of 113.9 in 2019 followed with one of 112.7, a notable reduction. The other half of the equation we have to address is Toronto’s defense. Toronto administered one of the greatest Playoff defenses in league history last season (~ 9 rDRtg), and the year-to-year regular-season differences don’t work in favor of Milwaukee. Toronto’s DRtg/A of 108.4 last season was quickly followed by one of 106.1, a two-point improvement from last year. 

    Toronto held opponents 1.5% lower than league-average in scoring efficiency last season, a mark replaced with 2.7% this season. Additional consideration can be placed in the opposing offensive quality Toronto faced in the last two seasons; the team played against an average -0.4 rORtg last year, a score followed by -0.2 this year. Toronto has limited opponent scoring efficiency to a higher degree while facing tougher opponents. Initially, these points don’t seem to advance Milwaukee’s case, and on their own, it doesn’t. However, there’s one factor we haven’t accounted for yet: luck. Toronto’s defense was historically-great last season, although a portion of it can be attributed to luck. The Raptors were an effective team in limiting opponents’ eFG% in 2019, as the aforementioned 1.5% mark indicated, but they limited the Bucks’ eFG% nearly four times greater (5.9%). Toronto’s rDRtg was slightly less than three times greater in the Playoffs than the regular season last year, an increment that doesn’t situate with the eFG% limitations.

    Therefore, Milwaukee’s efficiency drop was, in part, due to poor luck as well as Nick Nurse’s “wall.” It’s likely the wall alone wouldn’t have limited Milwaukee’s scoring efficiency to as high a degree without significant luck. It’s now an appropriate point at which I’d like to introduce the closeness of last year’s Eastern Conference Finals. Despite the four-game win streak and six-game closure, the series was won on the margins. Toronto outscored Milwaukee by one point per 100 possessions. If we substitute Milwaukee’s 5.9% drop-off in scoring efficiency with Toronto’s regular-season limitations of eFG% last year, the former team would’ve been in a position to win the series. Two of my viewpoints play a role in my favoring of Milwaukee, one being the “luck” factor and the other being the instability of historic play. The latter relates to teams’ difficulties in replicating historically-great performances from season to season. For example, the 2004 Pistons, the greatest Playoff defense ever, had an ~ 11 rDRtg in the Playoffs, a figure they didn’t come close to maintaining in the following seasons. Historic trends state the same will occur with Toronto.

    During the time in which I’ve analyzed the potential matchup between Milwaukee and Toronto, the Net Rating of the 2019 Eastern Conference Finals has been stuck in my head. Milwaukee was notably inferior last season, improving in NRtg/A by roughly +1.5 points, and it required the second-greatest Playoff defense in league history to outscore them by a single point per 100 possessions. Since then, Milwaukee has systematically improved while Toronto lost arguably the greatest wing defender of the current era. Adding in the “luck” factor and the instability of historic play, and I see a reasonable case in which Milwaukee reverses their scoring efficiency woes against Toronto in an upcoming Eastern Conference Finals.

    Toronto’s Offense

    Up until this point, the topic of conversation solely revolved around Milwaukee’s offense and Toronto’s defense. However, the inverse is equally important: how will Toronto’s offense perform against Milwaukee’s defense? At first glance, Milwaukee has some notable advantages. The team has improved its DRtg/A from 106.2 to a league-leading 103.7. Milwaukee currently possesses the foremost defense in the entire league by a wide margin; the runner-up in the statistic (Toronto) is more than two points behind. Conversely, Toronto’s offense has regressed. The team’s ORtg/A of 113.8 last season dropped to 112.0 this season, a significant decrease (likely) due to the loss of Kawhi Leonard. Although Leonard was likely never capable of anchoring a great offense during his time in Toronto (his passing was inadequate with the Raptors), he was the driving force on that side of the ball last year. Although some of Toronto’s key players like Norman Powell, Pascal Siakam, and Fred VanVleet have improved their situational value in Leonard’s absence, it hasn’t shown any improvement in cumulative performance.

    Milwaukee’s defense is tailored to exploit Toronto’s weaknesses. According to NBA.com, Toronto was one of the least-efficient teams in the paint (59.1% on attempts within 5 feet). On the other hand, Milwaukee is the foremost interior defensive unit in the league; they permitted the lowest FG% from within 5 feet of any team. Milwaukee isn’t especially proficient at limiting opponent three-point efficiency; the team held opponents 0.3% lower than league-average from long-range. Toronto is in the 87th percentile in three-point percentage among teams. However, as coach Mike Budenholzer and Milwaukee’s defensive schematics have taken note of, the most valuable shot in basketball is close to the basket. By limiting the efficiency and frequency of these attempts, Milwaukee has evolved into the greatest defensive team in the NBA. This strategy, as stated by the contemporary coordinations of the game, should serve well in any situation. If we take note of solely “input” statistics, or the stats that account for the “hows” in Milwaukee’s defense and Toronto’s offense, the former team garners stronger advantages.

    Additionally, if we view the grander view of events through cumulative performance statistics, Milwaukee’s defense is further poised to contain Toronto’s offense. During their sole season with Kawhi Leonard on the roster, the Raptors outscored an average team by 113.8 points per 100 possessions. The aforementioned drop paints Toronto as less than one standard deviation greater than league-average. Although the team’s players who were on the roster last year have grown and developed in their own rights, their isolated value remains relatively stagnant compared to their situation value. The loss of Kawhi Leonard diminished Toronto’s regular-season offense, and last year’s Playoff offense was nothing special with him. Playing against a team of Milwaukee’s defensive caliber, putting forth an offense like Toronto’s, isn’t likely to garner strong results unless an offense is great, an asset Toronto lacks. Milwaukee’s defense, as stated earlier, is one of the most ameliorated units in the NBA relative to last season, and Toronto’s modest Playoff offense isn’t in a position to instill a strong impression on Milwaukee’s new and improved defense. 

    Although a more firm supporter of Milwaukee, I see a rational argument in Toronto’s favor. Nick Nurse’s “wall” (partially) contained Giannis Antetokounmpo, although the most devastating effect was Milwaukee’s mediocre distance scoring, an asset forced to work more rigorously in last year’s Eastern Conference Finals. Toronto has permitted the lowest three-point percentage of any team this season. However, the Greek Freak is vastly superior to last season and Toronto lost two of the team’s key perimeter defenders (Danny Green and Kawhi Leonard). Budding star, OG Anunoby, is now available for them in the second season, yet it’s unlikely he’ll fully replicate the value those two provided last year. Add in Milwaukee’s invigorated defense and the instability of historic play (as well as the Bucks’ heightened distance scoring) and the evidence in Milwaukee’s favor is prevalent to me. Recently, in place of my “ChromCast” Playoff forecast, I retrodiction-tested NRtg/A scores for teams to estimate how well they match up against postseason opponents. Using this method, Milwaukee stands a 65% chance of winning a series against Toronto, and it’s a figure that largely aligns with my own thoughts. Therefore, Milwaukee is my foremost prediction to remain the sole team standing in the Eastern Conference this year.


  • Top 5 Scorers in the NBA

    Top 5 Scorers in the NBA

    Determining the best scorer in the NBA; it’s an intriguing premise and for good reason. Individual scoring is the most direct way to positively influence the scoreboard, and proficient scorers generally contribute higher amounts of value on random teams. I’ll be attempting to answer the aforementioned question to, hopefully, provide a solid framework through which we can further examine the league’s top scorers.

    – Rationale –

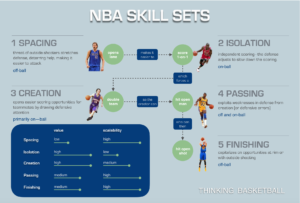
    The elements of scoring are properly tracked through visual and analytic principles, both of which were employed in compiling this list. The former more strongly relates to a player’s scoring “arsenal,” or the various ways a player scores within his traditional efficiency and volume stats. This includes observing different types of scoring moves, for example, floaters, fadeaways, and step-backs. However, the most relevant application of visual methods is examining a player’s off-ball scoring, a field unmeasured by statistics, that acts as one of the defining aspects of a player’s scoring repertoire. The presence of visual deductions is key in adding key context to a player’s scoring arsenal and incorporating what can’t be measured.

    Statistics will play an important role in measuring scoring proficiency as well. The traditional measurement of scoring volume is represented as “points per game” (PPG). In place of PPG, I’ll use “points per 75 possessions” (PTS/75), a stat that takes playing time and team pace into account to add context to the conventional measurements. Similarly, True Shooting Percentage (TS%) will be used in place of traditional shooting splits (FG% – 3P% – FT%). It’s noted as a superior efficiency measurement to the typical shooting splits taken together, and TS% can be more easily compared across seasons through Relative True Shooting (rTS%). The other widespread statistics I’ll use are free-throw percentage and three-point percentage to solely measure free-throw proficiency and three-point accuracy, respectively.

    Proprietary data, provided by Backpicks, was also used to determine the scorers on this list. Listed below are the metrics that were taken into account, their abbreviations, and what they measure.

    • 3P Proficiency (3P Pro): an estimate of three-point scoring proficiency combining both efficiency and volume
    • Scoring Turnover Percentage (sTOV%): the percentage of Offensive Load that comes from scoring attempts
    • Scoring Value (ScoreVal): an estimate of the number of points per 100 possessions a player contributes through scoring
    • True Scoring Percentage (TSc%): a measurement of scoring efficiency factoring “scoring turnovers”

    I’ll cite these metrics regularly throughout the player profiles. However, since this group of stats consists of proprietary measurements, I’ll more frequently depict them through percentiles instead of actual scores. The distributor of these metrics typically releases certain amounts of its proprietary data in the form of percentiles. This way, the metrics can be put into proper perspectives while respecting the data’s privacy. I’ll include a series of bullet points for each player that illustrates their strengths and/or weaknesses, providing a brief summary of a player’s scoring proficiency and repertoire. As is with every list I make, the purpose of today’s ranking is less centered around the specific placements and more the exchange of data and deductions on the league’s top scorers. Resultantly, I’ll include a series of ranges (an idea inspired by Ben Taylor), or how much higher or lower I could see a player ranked based on how competitive the playing field is, underneath each player’s summary.

    5. Karl-Anthony Towns, Timberwolves

    Towns’s name rarely enters the conversations on the league’s top scorers, yet he makes a relatively strong case. Minnesota’s star center possesses a three-dimensional scoring repertoire that starts with his interior play. Towns is tall and sturdy enough to compete with traditional big men, but his surprising agility and swiftness can dismantle opposing guards as well. His put-backs are relatively strong; Towns’s verticality can counter multiple defenders in the paint. His back-to-the-basket arsenal is increasingly proficient. Towns uses it to his advantage for passing, although it also serves well toward a strong post game, often resulting in quick turn-around jumpers. The strongest aspect of his scoring repertoire is his three-point shooting. Towns operates on the perimeter and weaves through opposing defenders like a guard. His quick form, seemingly just a flick of the wrist, created arguably the greatest-shooting center in league history. Towns is noted for his step-back three-point shot, which paired with his aforementioned long-range strengths, paints him as one of the premier outside shooters in the entire NBA.

    The value of Towns’s scoring is similarly reflected through his statistics. I calculated three-year weighted values of different scoring statistics with weights of 57.1% for a player’s most recent season, 28.6% for the prior season, and 14.3% for the season prior to that. Towns has a weighted scoring volume of 26.3 points per 75 possessions, which would rank in the 96th percentile (volume) among current players. His strong efficiency was a determining factor in his being here; Towns posted a weighted +7.5 rTS%, which when normalized to 2020 values, would stand in the 94th percentile (efficiency). However, the two most impressive figures in my eyes are his single-year 3P Pro (95th percentile), which matches his weighted score, and his league-leading ScoreVal this season, a mere two-tenths of a point lower than his weighted value. Towns elevates the Minnesota offense despite playing alongside a lackluster roster. The team’s Offensive Rating (ORtg) rises +12.22 points with him on the floor versus off the floor per PBP Stats. Towns makes a case as the league’s premier scorer this season, hence his fifth-place finish.

    Summary

    • Strong in interior play with a diverse arsenal
    • Mobility counters guards and big men effectively
    • Operates on the perimeter like a wing player
    • Arguably the greatest shooter at his position ever

    Although his proficiency as a scorer this season is enough to guarantee a spot on the list, I see the argument that he drops out of the top five to make way for a different candidate, like Kawhi Leonard. Towns has yet to garner enough Playoff experience to paint a clear picture of his second-season equity, a field Leonard excels in. Leonard’s three-year Playoff ScoreVal is higher than all notable current stars, including Stephen Curry and LeBron James, except for Kevin Durant. Leonard’s regular-season scoring is also quite close to Towns’s, but the latter’s superior floor-spacing and efficiency were determining factors in his selection over Leonard. On the other hand, I could also see Towns rise one spot to land in fourth. His weighted efficiency, spacing, and free-throw scoring are prominently superior to his successor on the list, and as a result, Towns makes a reasonable case to move up one spot. However, I see him most properly placed as the league’s fifth-most proficient scorer.

    4. Giannis Antetokounmpo, Bucks

    The Greek Freak, Giannis Antetokounmpo, has evolved into one of basketball’s premier scorers in the last three seasons. To understand his scoring prowess, one must be familiar with his interior and transition play. Antetokounmpo’s half-court scoring is driven by his athleticism and length. He weaves through multiple defenders when slashing en route to fruitful attempts at the rim. The Greek Freak’s verticality begets the end result of these attempts, with his 7’3″ wingspan guiding the ball into the hoop with frequency. Antetokounmpo’s transition proficiency equally models his aforementioned abilities. It’s among the league’s greatest individual skills; one of his strides covers arguably more ground than any other player in history. The Greek Freak generates 9.3 points per 75 possessions on transition plays with a 63.0 eFG%. He also leads the league in Real Adjusted eFG% (+2.39), a measurement of how efficiently a team scores with a player on versus off the court. Despite his massive strengths, he has little to no outside shot. Antetokounmpo converted on an adequate 39% of his mid-range attempts this season but stands in the 1st percentile in 3P%, the second-lowest mark in the league. Antetokounmpo dominates the paint and transition opportunities and, conversely, displays gaping holes in his scoring repertoire. Regardless, the Greek Freak remains a world-class scorer.

    Antetokounmpo was the highest-volume scorer of the season, despite lacking the potential to win this year’s scoring title. He played a mere 30.8 minutes per game, during which he managed to score 29.5 points. This translated to a league-leading 33.2 points per 75 possessions, surpassing the perennial scoring champion, James Harden. The Greek Freak is also one of the league’s most efficient scorers; he’s in the 90th percentile in weighted rTS%. Antetokounmpo’s most efficient area of scoring is close to the basket; he makes 73% of his shots at the rim (92nd percentile) on 11.5 attempts per 75 possessions. Despite his aforementioned three-point deficiencies, which paint him as arguably the worst shooter in the league, Antetokounmpo’s floor-spacing is considerably greater. Factoring in the number of attempts he takes from long-range, the Greek Freak is in the 34th percentile in 3P Pro, a significant increase compared to his standard percentage and a +6 increment from last season. Antetokounmpo may never grow into an elite, let alone good, outside scorer, but his improvements are sufficient in recognition as one of the league’s top-four scorers.

    Summary

    • Historically-great weapon in transition
    • Near equally proficient in the paint
    • 100th percentile-level scoring volume
    • Lack of outside shot holds him back

    Antetokounmpo is a unique case among the players on this list. His efficiency, volume, and overarching scoring value seem adequate to propel him to a higher spot, but his lack of an outside shot is the main hindrance in doing so. As stated earlier, these deficiencies are enough for me to see him drop back to the fifth spot, but no lower. The Greek Freak’s league-leading volume and positive efficiency (as well as a 100th percentile ScoreVal), in my eyes, prohibit a further drop. Conversely, I don’t see the argument for him to rise any higher. The subsequent players on this list display similar volume and efficiency with the three-point proficiency that Antetokounmpo lacks. The range most fitting for the Greek Freak, in my eyes, results in his placement as the fourth or fifth-best scorer in the NBA.

    3. James Harden, Rockets

    James Harden was the recipient of the last two scoring titles and is due for his third by the end of this week, and for good reason. He’s noted as one of the NBA’s foremost isolation scorers, anchoring perennially-great Rockets offenses. Harden averaged 1.13 points per isolation possessions (92nd percentile) this season, translating to a generated 15.2 points per 75 possessions on these plays. He usually begins these possessions at the perimeter, where he dances with opposing defenders with his routine between-the-legs dribbling montage. Harden then either shoots from the three-point line, where he makes 35.4% of his attempts (30th percentile in 3P%), or the rim, where he makes 63% of his attempts. He takes 83.1% of his attempts in either the paint or from the three-point line. For the first time since the 2016-17 season, Harden’s three-point percentage has been lower than league-average. However, the volume at which he takes long-range shots is likely a product of diminishing returns on high shot frequency. Harden is presumably still a strong three-point scorer, despite what his percentages suggest. He’s surprisingly strong in the interior, muscling into the paint and converting at a modest 67% rate on attempts between 0-3 feet.

    The totality of Harden’s scoring is massively stronger than his aforementioned statistics suggest. Last season, he set the regular-season record for scoring volume, averaging 36.1 points per 75 possessions (highest all-time). Harden’s three-year weighted value stands at 33.4 points per 75 possessions, while the current season places him at 32.5 points per 75 (100th percentile). Harden is also one of the league’s most efficient scorers in totality, posting a weighted +5.8 rTS% (90th percentile). The more impressive deduction on his efficiency is that despite its high value, it’s also a product of diminishing returns on high shot frequency. Harden was in the 99th percentile in TSA per 75 possessions this season. His three-year weighted ScoreVal would be the highest score in the NBA this year, and his current ScoreVal is in the 99th percentile. Harden’s three-point percentage isn’t indicative of his true abilities; he’s in the 58th percentile in 3P Pro. Harden is not an elite shooter, but his high volume consistently draws defenders to the perimeter.

    Summary

    • Threat from all three main ranges
    • Highest-volume scorer in history (depending on interpretation)
    • Not elite, but high-volume three-point scorer
    • Diminishing returns undervalue his efficiency

    James Harden, as mentioned earlier, is (based on peak) the highest-volume scorer in NBA history. Among players who have averaged more than 33 points per 75 possessions, Harden has the highest rTS%. His ScoreVal in the 2019 season is in the 100th percentile historically (60th among players since 1955). Last season may not have been the greatest single-season scoring campaign in league history, but its record in volume puts Harden’s scoring into perspective. As a result, I could see Harden reasonably ranked as the game’s greatest scorer today. After all, his elite volume mark was set a sole season ago, which when paired with great efficiency, makes a strong case in Harden’s favor. Conversely, the lowest I see Harden ranked is the spot he’s currently in, third. His scoring doesn’t maintain value in the Playoffs like the successors on the list have displayed. Harden’s three-year Playoffs ScoreVal is a full point lower than his three-year weighted regular-season ScoreVal. Regardless of a number of setbacks from the top spot, Harden is one of the greatest scorers in NBA history.

    2. Kevin Durant, Nets

    I’m evaluating Kevin Durant on how he performed before his Achilles tear due to the uncertainty of his current scoring value, hence his second-place berth. Similar to his predecessor and successor on this list, Durant is a historically-great scorer. He’s highly proficient in the paint, mid-range, and three-point areas. Durant’s frame (6’10” without shoes) and long arms (7’5″ wingspan) allowed him to excel in interior play despite a more lanky build. He’d often catch fast-break passes at the half-court line and convert on feasible dunks. However, the most impressive aspect of Durant’s scoring is his mid-range proficiency. Last season, he put together one of the greatest mid-range campaigns in league history, making 52% of his attempts between 10-23 feet. Durant was also one of the NBA’s perennially-great distance scorers, making 38.4% of his three-point attempts with the Golden State Warriors. His length and shooting proficiency make Durant one of the NBA’s “unblockable” scorers. The apex of Durant’s jump shot is only rivaled by the longest of verticalities and wingspan, and as a result, only 3% of his attempts were blocked last season.

    Durant’s three-year weighted scoring volume stands at 27.1 points per 75 possessions; however, this measurement may be underestimating his true proficiency. Durant took 2.8 fewer field-goal attempts per 100 possessions from 2016 to 2017 (the season in which he joined Golden State), which likely deducted a noteworthy number of points from his volume statistics. Durant is one of the league’s most efficient scorers, having posted a rTS% no lower than +7.4 since 2017, a large testament to his conversion rate factoring shot frequency. Durant had the fourth-highest ScoreVal last season, corroborating the idea that he effectively incorporates volume and efficiency into the equation. His three-year weighted ScoreVal would be in the 100th percentile today. However, the more impressive mark is Durant’s translating to the Playoffs. He has the highest three-year ScoreVal in the postseason of any active star in the league. Durant’s reputation as an elite Playoff performer is ratified by this figure and makes him arguably the greatest scorer in the NBA.

    Summary

    • Length allows him to excel in the paint
    • Mid-range scoring is on a historic level
    • Three-point shooting at his size is unparalleled
    • Greatest Playoff scorer in the game today

    Kevin Durant, as evident from his historically-great scoring repertoire, is one of the greatest scorers in NBA history. His regular-season peak (2012-13) saw him post the seventh-highest ScoreVal of all time, a season in which he averaged 31.4 points per 75 possessions on +9.4 rTS%. Durant also holds the #8 and #20 spots on the all-time ScoreVal leaderboard, verifying the longevity with which he maintained historic scoring performances. In addition to his regular-season equity (Durant is third in three-year weighted ScoreVal in the regular season among players on this list), his lift in the Playoffs (Durant averaged nearly 30 (inflation-adjusted) points per 75 in the last three postseasons), in my eyes, creates a case as the league’s top scorer today. The only factor prohibiting him from finishing first is the fact that arguably the greatest offensive player of all time is currently playing. On the other hand, I could see him drop to the third spot on this list. James Harden’s historic volume and positive efficiency are enough for me to reasonably see Durant in third place.

    1. Stephen Curry, Warriors

    Stephen Curry is, in my eyes, a strong candidate as the NBA’s greatest offensive player in league history, and the strongest factor is his scoring. Curry was the driving force behind one of basketball’s greatest offensive dynasties ever. The Golden State Warriors posted an ORtg > 120 with Curry on the floor from 2017 to 2019, a testament to his aggregate offensive game. His scoring, however, stems from his distance shooting. Curry is the greatest three-point scorer in league history, having made 44% of his career attempts from long range. He’s the most gravitational player ever, drawing defenders from all over the court to prevent his historic range. Curry’s scoring inadvertently creates a large number of shots for his teammates, suggesting his scoring transcends simply putting the ball in the basket. The most undervalued aspect of Curry’s scoring, however, is his off-ball scoring. He’s one of the most proficient off-ball scorers in league history, routinely darting through screens and weaving through defenders on the perimeter. Curry’s scoring is perennially great, having arguably been the league’s greatest scorer in every season since his 2015-16 MVP campaign (perhaps with the exception of James Harden’s historic 2019). 

    Curry is in the 100th percentile in three-year RA-eFG%, boosting an average team’s eFG% by 3.15%. His individual scoring prowess translates to team proficiency as well as any player in the league. Curry’s three-year weighted 28.9 PTS/75 would be in the 98th percentile (volume) in today’s NBA, and his three-year normalized rTS% would be in the 97th percentile (efficiency) today. Curry is also the greatest free-throw shooter in history, converting on 90.6% of his career free-throw attempts, the highest mark (FT%) in league history. His weighted ScoreVal would be the highest in the NBA in 2020, and his weighted 3P Pro would similarly rank in the 98th percentile (3P Pro). Curry’s latest MVP season makes a case as the greatest single-season scoring campaign ever. He posted the highest single-season ScoreVal (+3.3 points per 100 possessions) in NBA history. The most impressive (and anomalous) statistic of Curry’s in the second season is his > 54 inflation-adjusted PTS/75 in the Playoffs, suggesting he maintains his regular-season value in the second season.

    Summary

    • Greatest distance scorer in history
    • Greatest free-throw scorer in history
    • Arguably greatest off-ball scorer ever
    • Most gravitational player of all time

    I see Curry as one of the greatest scorers in league history due to the overarching points in his summary. He’s arguably the greatest scorer ever in three prominent aspects: distance, free-throw, and off-ball scoring. Curry draws more defenders than any player in basketball history, indicative of his perceived scoring threat in the minds of opposing defenses. The highest I could rank Curry in reason is his true spot, first. As stated earlier, he’s possibly the greatest offensive threat of all time; and when paired with historic volume and efficiency, creates a strong case as the league’s premier scorer today. Conversely, I could see Curry dropping to second for one key reason. His three-year ScoreVal drops in the Playoffs by 0.2 points. Although it’s a minor decrease, and still remains one of the highest scores in the league, it’s surpassed by stars like Kevin Durant, LeBron James, and Kawhi Leonard. It’s worth noting Curry has suffered numerous injuries in the past four postseasons, likely hindering him from historic Playoff scoring. However, it’s unlikely Curry would surpass Durant in Playoff scoring equity, and as a result, I could see the two reasonably switched.

    – Conclusion –

    As I mentioned earlier in the article, the order in which these players appear isn’t meant to act as a definitive assortment of scorers on my end. The concluding paragraphs of each player profile illustrated the various ranges in which I could reasonably see players ranked based on how close together some of them are. It’s also worth noting this list was a product of one person’s opinion using one person’s preferred rationale. My intention for this list is to share the information and thought process that went into these rankings and how I’d eventually stack these players against each other to, as stated earlier, provide a framework through which we can further assess these scorers. Thank you for reading, and I hope you all have a great rest of your day!


  • Introduction to Composite Metrics in the NBA

    Introduction to Composite Metrics in the NBA

    (Picture courtesy of FiveThirtyEight)

    If one were to indulge in the scope of NBA analysis, they’d be met by an increasingly large number of methods, ranging from visual to analytic tools. Film study is a relevant, predominant element of modern NBA analysis, and one that when properly wielded can draw strong inferences. However, the foremost option in a player analysis lies in advanced statistics. Despite various suppositions from a subset of questioning individuals, advanced stats are great at estimating a player’s value. They’re widely cited in a broad range of places: social platforms (Discuss TheGame and Instagram) to professional sports analysis and networking (APBRmetrics and ESPN). The widespread trust and utilization in and of advanced stats corroborate the validity of the underlying premises. The succeeding descriptions exist to explicate the calculations and identify the proper use of advanced stats.

    [1] Prerequisite Knowledge

    The complexity of NBA statistics varies depending on the statistic at hand. Martin Manley’s “Efficiency” (EFF) stat, which measures individual player efficiency, goes as follows:

    EFF = [(PTS + TRB + AST + STL + BLK – Missed FG – Missed FT – TO) / GP]

    The general grounds of EFF are apparent to most, with positive contributions weighed positively, negative contributions weighed negatively, and the sum eventually adjusted for playing time. The most valid player statistics incorporate more complex subdivisions of mathematics, often superseding traditional arithmetics. To maximize the retention of the formulas for the selected advanced stats, a rudimentary knowledge of linear algebra and regression analysis is highly recommended. The principles of “holy grail” statistics are largely dependent on these two math subdivisions.

    To encapsulate the use of matrices and the least-squares solution in advanced stats, the formulation of Adjusted Plus/Minus (APM) will act as the primary step in the manipulation of matrices. Traditional Plus/Minus measures the Net Rating (point differential per 100 possessions) of a given player’s team when he is on the floor. If “Player A” is on the court for twenty possessions and his team outscored the opponent by a single point, “Player A” is credited with a +5 Plus/Minus. Plus/Minus is notoriously biased toward players on great teams playing against inferior competition, as Plus/Minus is insensitive to the quality of teammates surrounding a player and the difficulty of the opposition. Depending on these external factors, a player’s Plus/Minus could either inflate or deflate, straying away from the player’s true value.

    The calculation[1] of APM employs an n (number of possessions) x (number of players involved in the possessions) matrix X. The following step consists of classifying whether a player is on offense, defense, or off the floor with the numerical denotations 1, -1, and 0, respectively. The matrix equation to solve for the beta-values that give the point differential goes as follows: 

    The beta-values are yielded through the least-squares solution, a method used to minimize the sum of square residuals, fitting the data closer to the mean. The approximated β coefficients are players’ APM scores. APM, in theory, is the “holy grail” basketball metric, providing a suppositionally true value score. APM does suffer from phenomena like multicollinearity, begetting the formulation of Regularized Adjusted Plus/Minus (RAPM), which combats the extreme variance in APM and reduces standard errors. As implied through its name, RAPM employs a ridge regression, more specifically an L2 regularization, to reduce variance and center the results from APM. The modification of the least-squares solution to fit the diagonal perturbation matrix λI, a methodology that approximates solutions starting at simpler problems, goes as follows:


    The resulting beta-values act as the RAPM scores for players. RAPM garnered recognition as the foremost basketball metric due to its strong foundation and the underlying premise. RAPM isn’t perfect, often taking several years to stabilize, after which the metric was largely taken in three-to-five-year samples. Despite the less positive noise surrounding it, RAPM serves as the base regression for the cream of the crop of one-number metrics. The understanding of RAPM is crucial in also retaining the formulations of its “offspring.”

    • Click here to see the RAPM leaders for the current season
    • Click here to see the RAPM leaders from a three-year sample

    [2] Regression Models

    Elementary grasps of regression analysis are additionally applicable in calculating regression models. The bases of several widespread metrics are multiple regressions on multi-year samples of RAPM. NBA Shot Charts is often recognized as the primary RAPM distributor and the most frequent base for an RAPM regression, but similar models (see Jacob Cutter‘s and Simon Zou‘s open-source RAPM models) could also act as strong bases. It’s worth noting the variety of models to determine a player’s RAPM. There isn’t a definitive solution, creating room for a variety of methods. The overarching premise of these stats is to assign coefficients to certain values (box score, On-Off ratings, etc.) based on their correlation to RAPM. These one-number metrics are differentiated based on the chosen values (box score/On-Off ratings, etc.) and the variation/length of the RAPM data set. 

    Box Plus/Minus (BPM)

    Developer: Daniel Myers

    Box Plus/Minus consists of a predominant pair of counterparts, provided through Basketball-Reference (Myers’s model) and Backpicks (Ben Taylor’s model). The former includes a detailed description of its methodology and calculation process, two elements the Backpicks model lacks, hence its appearance. BPM estimates the number of points relative to league-average a player contributes every 100 possessions. The statistic is calculated with solely box score values. BPM is based on a twenty-year sample of “Bayesian Era” RAPM, which uses a prior probability distribution that considers team quality and minutes per game in its seasons. The regression includes sets of coefficients for cumulative BPM and its offensive half (OBPM), with variances based on position (e.g. steals are weighed more for centers than point guards due to positional difficulties). BPM builds on the regression coefficients with a series of adjustments based on team quality (in BPM and OBPM) and position. Multiple regression coefficients typically remain stagnant due to optimized data, but BPM’s weaker correlation to RAPM (compared to other one-number metrics) allows for more flexibility in adjustments.

    BPM is limited by a solely box-oriented calculation but remains one of the stronger metrics in player analysis. Retrodiction testing, the process of predicting team equity (in Simple Rating System (SRS)) based on a rosters’ players’ previous stats, paints it as on par with play-by-play informed stats. From 1978 to 2019, compared to Win Shares, Backpicks BPM, and Player Impact Plus/Minus (PIPM), BPM had an SRS error (the absolute difference between predicted and actual SRS) of approximately 3.8 with a lineup continuity (the percent of the remaining roster from the previous year) of 60% (third) and an SRS error of approximately 2.5 with a lineup continuity of 95% (first), solidifying its status as a highly indicative stat. BPM’s predictive power transcends its descriptive power, however. Its descriptiveness is summarized through its Pearson correlation to RAPM, which stands at a rounded 0.66[2]. Despite restrictions due to an exclusively box-score formulation, BPM serves mostly well as an indicator of player value, and an even stronger prospective evaluation.

    • Click here to see an in-depth overview of Box Plus/Minus
    • Click here to see a walk-through calculation of Box Plus/Minus

    Robust Algorithm using Player Tracking and On/Off Ratings (RAPTOR)

    Developer: FiveThirtyEight

    FiveThirtyEight‘s “RAPTOR” metric is the newest of the popular one-number metrics (released in October of 2019), but makes a case as the most descriptive and predictive. The site previously employed an Elo-based projection that garnered a reputation as one of the most accurate NBA projection models, most notably predicting the Toronto Raptors’ championship run last season. FiveThirtyEight implied it created the RAPTOR metric for one overarching reason: modernization. RAPTOR employs more modern NBA data (player tracking and play-by-play) and models the preferences of NBA teams. The stat only uses data available to the public. RAPTOR measures the number of points relative to league-average a player contributes per 100 possessions. RAPTOR is based on a six-year RAPM sample, including components from an expanded box score and luck-adjusted On-Off ratings. Evidently, the coefficients for the enhanced elementary stats are determined through the aforementioned regression, which was based on a six-year sample of RAPM. The predictive power of RAPTOR hasn’t yet been tested, but the metric serves as the foundation of FiveThirtyEight‘s projection model. Although denoted as a descriptive stat, RAPTOR’s correlation to the base regression isn’t explicitly stated. The premise of RAPTOR is inherently strong, and time will tell the individual proficiencies and deficiencies of the metric.

    • Click here to see an in-depth overview of RAPTOR
    • Click here to see the GitHub for the RAPTOR data

    Real Plus/Minus (RPM)

    Developers: Jeremias Engelmann / Steve Ilardi

    Real Plus/Minus, the featured statistic of ESPN, is similarly modeled to the preceding statistics in BPM and RAPTOR. The base regression is on a set of xRAPM (Engelmann’s RAPM model) to estimate a player’s contributions on the offensive and defensive ends in a Net point differential. RPM is the most exclusively engineered statistic among the widespread set, with little to no light shed on its calculations. The stat is most noted for its predictive power, acting as the driving force of ESPN‘s NBA projections. If one were to make suppositions of RPM, it may consist of a variety of points. Engelmann, the co-developer of RPM as well as xRAPM, garners a strong reputation for building world-class valuation models, and the assumption that RPM likely holds a high Pearson correlation to xRAPM is rational. The number is an estimated 0.71[3], making it of statistical significance against RAPM. RPM is as proprietary as a publicly-available metric could be. Ideally, a more informed methodology and rough calculation would be published. Limited validity testing is available to determine the numerical equity of the stat. However, due to the developer, distributor, and the given premise of RPM, it’s a foremost citation to estimate player value.

    • Click here to see ESPN‘s (brief) overview of RPM
    • Click here to see a related Engelmann lecture

    Player Impact Plus/Minus (PIPM)

    Developer: Jacob Goldstein

    Player Impact Plus/Minus is the primary impact metric of Basketball Index. PIPM estimates the number of points a player contributes on offense and defense per 100 possessions, mirroring its predecessors. The stat employs two similar components to RAPTOR: an expanded box score and luck-adjusted On-Off ratings. The box-score prior and On-Off ratings incorporate “pace-adjusted per 36 minutes” stats and relative luck-adjusted On-Off ratings, respectively. Although it’s not explicitly stated, it could be inferred the “luck-adjusted” component of the On-Off ratings accounts for team and opponent context: the quality of teammates and opposition, perhaps. Luck adjustments in these contexts also relate to a player’s unexpected progressions or regressions, for which career numbers are substituted (a concept used in luck-adjusted RAPM). The former may have more likelihood, but either description is possible. The coefficients for PIPM were determined through a regression on a fifteen-year sample of Engelmann’s RAPM. PIPM holds unprecedented accuracy, maintaining a Pearson correlation of 0.875 to the base regression. The communal precision of PIPM creates one of, if not, the foremost metrics in player analysis.

    PIPM’s validity is maintained in retrodiction testing. As a part of the initial group of tested metrics stated earlier, PIPM held the lowest SRS error between 60% and 90% lineup continuity, permitting a marginal difference to Box Plus/Minus nearing 95%. The evidence suggesting PIPM’s clarity makes it a contender for the most valid one-number metric in the NBA.

    • Click here to see an in-depth overview of PIPM
    • Click here to see seasonal and multi-year PIPM leaders

    [3] Conclusion

    The premises of the aforementioned statistics – BPM, RAPTOR, RPM, and PIPM – imply an important principle: metrics are great indicators of player value. The term “value” initially garnered negative noise as it was generally used in a situational context, but the establishments of these one-number metrics created the “isolated” value measurements. They account for the quality of teammates and opponents to confidently estimate player impact on a leveled playing field. These ideas have been expanded on to create the concepts of portability (how well a player’s skills scale alongside great teammates) and diminishing returns (lessened situational value alongside greater teammates). Advanced statistics clear a lot of noise around traditional stats, introducing analytic concepts and new calculation approaches to (very precisely) estimate a player’s value. Advanced statistics will remain a principal tool in player analysis, and a firm grasp of their processes and measurements is a fundamental step in analytic retention.


  • Determining the Most Valuable Player in NBA History

    Determining the Most Valuable Player in NBA History

    Determining the most valuable player in NBA history is one of the foremost prompts in the game’s historic contexts. It’s a multidimensional dispute that remains largely unoptimized. The existence of varying criteria is increasingly prevalent, especially during the imminent rise of reference points to base claims on. Although an opinionated nature to the aforementioned topic isn’t anomalous, these types of reasoning blur the more grounded viewpoints that garner stronger results. Employing the most sound rationale and assimilating the most valid measurements paints a relatively clear picture of the value of basketball’s all-time greats. These adjustments to the traditional techniques create one variation of determining the most valuable basketball player in history.

    [1] Rationale

    Similar to the aggregate of sports analysis, the following determination will and won’t include some of the more widespread elements in likewise analyses. The criteria aren’t intended to act as a definitive, ultimate rationale toward the topic, rather one singular approach to answering one of basketball’s most intriguing questions.

    [1.1] Exclusions from Convention

    If one were to examine the prototypical rationale of one singular player determination, it would include that player’s legacy as a highly-weighed factor. The number of MVPs and championships won, All-NBA and All-Star appearances, and transcending influence create a fraction of the components in a player’s legacy. The following determination will not place stock in a player’s legacy. Single-season awards aren’t perfectly assigned, nor do they point toward the true value of a player. Similarly, winning championships isn’t an individual operation. Backpicks‘s primary player valuation model estimates the very greatest player seasons provide the players’ given teams an extra 30% odds to win the title that season, illustrating the importance of the supporting cast in title-winning teams. Despite the mind-boggling performances of LeBron James and Kawhi Leonard in the Playoffs during the past seasons, one player isn’t expected to provide a team with an entire championship’s worth of equity. Team success is a commonly-referenced element in determining player value, but its large dependence on circumstance and situational conditions eliminates it from the criteria of the following assessment. 

    For example, Player A was credited with an increment of 20% title odds and Player B was credited with an increment of 16% title odds in the same season (including equal health). The latter player’s team won the championship that year. It could appear that Player B was worth more championship equity because of his team’s success, but Player A had truly been the more valuable player that season.

    The additional point of disparity from tradition is in the types of statistics worth referencing. Standard points of statistical reference include the traditional recordings of points, rebounds, assists, steals, and blocks per game and the shooting slash line in which field goal, three-point, and free-throw percentages are included. The former statistics create a tenuous model to statistically evaluate a player, especially in answering the aforementioned question, considering the cross-referencing between different eras (on a side note, players won’t receive less credit due to playing during a certain time). Although the presence of pace-adjusted (per 75 possession) and cumulative efficiency (eFG%, rTS%) statistics are primary reference points in individual player analyses, the following determination will rely on skill-oriented statistics as secondary credentials to make way for compound player valuations (the most valid one-number metrics) as primary components. The statistics referenced in the following assessment were selected due to the quality of sources, validity in year-to-year consistency (especially with lower lineup continuity), and positive retrodiction testing.

    [1.2] Inclusions from Resource Pool

    Although it’s a commonly untapped subject in the assimilation of a list related to the aforementioned question, visual elements will act as an important aspect in determining the most valuable player in history. Film study acts as a foremost consideration in current and historic player analysis, adding needed context to the scores displayed through statistics. Skills including on and off-ball defense and quality of passing aren’t audaciously measured, and thus prompt the need for visual analysis. 

    “Film study” as it’s defined in the following assessment isn’t intended to correlate with the “eye test,” the latter of which uses visual methods to determine worth, while the former simply adds context to the measurable and supplies the immeasurable

    The primary framework in the following determination is the positive equity a given player had in a variety of lineups. Similar to the “The Backpicks GOAT” list, the following assessment is partially based on CORP, a model that determines the odds a player provides a random team with winning an NBA championship, through which the term “value” is defined for the following assessment. The primary aim of a team is the win an NBA championship, and the most valuable players are the ones who provide their teams with the greatest odds to win. CORP will serve as an important, but not definitive, factor in the determination. It’s the most valid widespread metric to determine random title odds, but is largely afflicted by injuries in the Playoffs, which slightly hinders some of the results. Stephen Curry was credited with one of the five most proficient peaks in league history, but his championship odds during the 2015-16 season were limited to a strong MVP level campaign (as opposed to an all-time level) due to an injury in the second season. Player seasons without health hindrances create for the clearest view of true CORP scores, and the premise of the metric vaults it into consideration.

    The bulk of the remaining metrics cited throughout the following evaluation consists of Plus/Minus and “With or Without You” (WOWY) scores. The former category will encompass the more widespread Box Plus/Minus (BPM) statistics. Basketball-Reference‘s model will act as the primary resource for BPM scores, but the Backpicks version of the metric will also include citations throughout the assessment. The remaining Plus/Minus statistics will include the versions enhanced with play-by-play data: scaled Adjusted Plus/Minus (APM), Regularized Adjusted Plus/Minus (RAPM), and likewise metrics. APM models were created to contextualize and expand On/Off Plus/Minus totals, the latter of which often provided poor results. APM statistics factor in teammates played (a generally weaker supporting cast with one great player on the floor could skew On/Off results) and the quality of opponents to measure a player’s impact on his team within a game. RAPM models were spawned through APM but employed the Bayesian technique, the usage of which eliminates the irregularities of anomalous data in APM models. RAPM acts under the same premise of APM, but wields a ridge regression to garner stronger results.

    Although APM and RAPM models are widely recognized as the most valid one-number metrics to evaluate basketball players. they aren’t the only statistics worth considering. As stated earlier, WOWY models will be employed to examine a similar construct through a slightly varying viewpoint. They estimate a player’s impact with a Plus/Minus-esque format but operate on a game-to-game basis rather than within a game. APM models work with data representing a player’s impact within a game, or how the team performs when a player is on and off the floor and shuffled into different lineups. WOWY measures a player’s impact from game-to-game, acting as a pure tool to approximate a player’s value on his roster. The grounds of WOWY removes the prospects of needing to cut highly correlated factors either manually or through employing regression methods to eliminate multicollinearity, which is more common in lineup-oriented statistics. APM and WOWY possess their strengths, but the former metric will act as more primarily cited, as the foremost principle in answering the sport’s most prevalent question is to provide a highly isolated estimate of impact. Consideration will be placed in APM and WOWY models, but with the underlying premise as to the true measurements of either metric.

    Additional advanced statistics including Win Shares or WS/48 may/will be cited solely to cross-reference between eras. The validity of the Win Shares metric is surpassed by the bulk of impact metrics; the most foolproof of them were explained earlier. See Nylon Calculus‘s article for an explanation as to which advanced statistics are most valid in player analysis

    The assimilation of impact measurements begets the necessity to balance longevity and peak. For example, Player C was worth a 2.01 career valuation with a peak of 24% title odds, while Player D receives a career valuation of 2.09 with a peak of 20% title odds. The determination between Player C and Player D largely depends on a preference of either longevity or peak. The following assessment will consider either side of a player’s résumé to determine the most valuable player in history (i.e. total career contributions won’t outweigh similarly lengthy careers with superior peaks, or vice versa). There doesn’t exist a direct template to compare longevity and peak in the following exercise, and neither aspect will act as the definitive factor in the determination.

    [2] Determination

    The employment of the criteria in the preceding texts drew forth one perspective’s answer to determine the most valuable player in NBA history. The player performed exceptionally well according to visual and analytic principles, outlined some of the most optimal odds to provide a random team with winning a championship, and portrayed some of the highest impact metric scores to support his title as the most valuable player in history: Michael Jordan.

    Although a wide variety of players was examined for the exercise, the criteria slimmed candidacy down to three strong potential recipients: Kareem Abdul-Jabbar, LeBron James, and Michael Jordan. The prospect of comparisons will include the trio of these contenders.

    [2.1] Input

    Jordan’s most valuable asset was his historic engrossment in scoring with efficiency and volume. Jordan concluded his career with an average of 30.3 points per 75 possessions and a +3.5 rTS% (rTS% is referenced in place of TS% to account for variances in scoring efficiency across eras). His world-class athleticism and verticality created one of the greatest inside scoring threats in league history. The majority of basketball viewers are familiar with his up-and-under layups and free-throw line dunks, both of which exemplified the lengths through which Jordan could score the basketball. The post wasn’t Jordan’s primary scoring range, as he attempted far more shots from the mid-range during the shot tracking era. Limited shot tracking data allows for range examination in the concluding years of Jordan’s career. During the 1996-97 regular season, he made more than 50% of his shots from mid-range except from ten to sixteen feet, in which Jordan remained close to the aforementioned mark (49.2%). Jordan was extremely proficient inside the arc, in which he made 51% of his attempts. Conversely, Jordan’s career three-point efficiency was 1.3% lower than the cumulative (from every season in which Jordan played) league-average. His scoring remains unparalleled in league history.

    Backpicks compared Jordan to several all-time greats (Bird, Bryant, Curry, James, Johnson, and Nash) in terms of the site’s “Big 4” offensive factors: scoring efficiency, creation, scoring volume, and retention, adjusted to mirror Playoffs-scaled three-year peaks. Jordan placed fourth in scoring efficiency (rTS%), third in creation (Box Creation), first in scoring volume (PTS/75), and first in retention (TOV%). 

    Jordan’s impact on the opposite side was among the most proficient displays of defense from a shooting guard in league history. Backpicks revealed Jordan record six of the two-hundred highest steal percentage (STL%) scores, the foremost of which was the forty-second highest score in the history of its tracking. His steals garnered high praise at surface value, but Jordan’s defense wasn’t consistently elite. During the first three seasons of his career, Jordan received a reputation as a defensive gambler. He’d steal the basketball at an extremely high rate, but at a price that often manifesting as points for the opposition. Jordan’s defense massively improved in his fourth season, during which he conveyed career-highs in STL%, block percentage (BLK%), and DBPM. His on-ball defense was the asset that created Jordan’s elite defensive campaigns, through which he opted for smarter defensive rotations and superior paint protection. He recorded the seventh-highest single-season BBR DBPM score that season. Jordan evolved into a less active defender during the 1990s, a time in which he’d seemed to reserve energy for stronger efforts on the offensive end. 

    [2.2] Output

    The bulk of widespread one-number metrics point toward Jordan as one of the greatest players in basketball history. He holds the career record for BBR BPM (9.22), maintaining a mild advantage over the second-place recipient. Jordan’s prime consisted of the second-highest single-season BBR BPM score (12.96 in 1987-88) and the highest single-season BBR VORP (a BPM-based metric that accounts for playing time) score (12.47 in the same season), creating one of, if not, the greatest primes in basketball history from box-oriented view. Jordan’s productivity translated to the Playoffs at the highest level of any player, posting the highest career BBR BPM of the second season (11.14) in league history. Jordan was also credited with the second-greatest postseason run since the Box Era, conveying a 14.63 BBR BPM during the 1991 Playoffs. Although the bulk of Backpicks data remains proprietary, it is known Jordan holds the second-highest peak BP BPM score (12.6) in basketball history. Despite the recurring retirements throughout his tenure in the NBA, Jordan’s impact on the court creates one of the greatest careers in league history.

    Jordan’s impact on his teams transcends the box score, exhibiting an equally strong résumé in play-by-play-oriented advanced statistics. Backpicks‘s manipulations of WOWY created the WOWYR metric, the latter of which employs a ridge regression. RAPM’s claim to fame revolves around the same modeling, placing stock in the rationality of certain ranges. Jordan was exceptionally valuable through the WOWYR keyhole, posting a prime (1985-1998) WOWYR of +9.0 and a career WOWYR of +8.2, materializing the impact he had on his rosters. Backpicks followed its commencement of WOWYR with “GPM,” a set of game-scaled APM statistics, through which a ten-year scaled version was created. Jordan had one of basketball’s greatest decade-long runs according to GPM measurements, in which he recorded a +7.6 average game value. Limited seasons of APM, RAPM, and Augmented Plus/Minus (AuPM) – which mimics APM without the direct play-by-play data used in APM – paint a clear picture as to Jordan’s value near the tail end of his tenure in Chicago. Backpicks estimates if APM calculations were attainable during the earlier stages of his career, Jordan could’ve marked some of, if not, the greatest APM/RAPM scores of any player in league history. 

    Backpicks‘s statistical profile of Michael Jordan unveils a set of data to largely support his candidacy as the game’s most valuable player ever. He holds the fourth-highest prime WOWYR score (higher than Abdul-Jabbar and James) and the ninth-highest three-year AuPM/RAPM score (which doesn’t act as a true representation of his prime, as the seasons in which the scores were recorded ranged from 1996-98), but points toward the potential greatest-ever status of Jordan’s prime.

    The data that truly exemplifies Jordan’s historic prime lies in the Backpicks CORP model, represented through “Title Odds on a Random Team.” As the title suggests, CORP measures the odds a player would provide a random team of winning an NBA championship. The “CORP calculator” draws a proprietary “SIO” measurement: the impact a player would make on a 0 SRS team. The SIO value is plugged into an “SIO curve” that accounts for diminishing returns among stronger lineups (a player’s impact is lessened on a greater team compared to a weaker supporting cast). The CORP grading scale includes eight tiers to categorize variances of title odds, ranging from a role player to a “goat” season. Following the 2018-19 season, Jordan contributed the third-greatest cumulative title odds, preceding competitors in Abdul-Jabbar and James. The balancing of longevity and peak was the concluding factor of Jordan’s relevance in the statistic, through which mean title odds during a career were more highly weighed compared to total career valuations. Among the top three candidates, Jordan was the sole player to contribute title odds of more than or equal to thirty percent, a feat he accomplished in three consecutive seasons (1989-1991). 

    Abdul-Jabbar, James, and Jordan conveyed varying title odds according to the Backpicks CORP model. Abdul-Jabbar received a career valuation of 2.99, which stands as the highest score in league history through the 2018 season. The seasonal value of the aforementioned score, which will be referred to as “CPS” during the exercise, grants Abdul-Jabbar a mean score of 0.15 per season. His absolute peak in 1977 recorded title odds of around 26%. James receives a career valuation of 2.79, which doesn’t account for his performance in the last two seasons, but places second among players in history. His average CPS of 0.17 suggests James could pass Abdul-Jabbar this season and will likely retire as the most valuable player in purely cumulative value. James peaked in the 2012-13 season according to the CORP model, displaying title odds marginally exceeding 28%. Jordan concludes the trio as the foremost player in terms of “rate CORP.” He garnered a career valuation of 2.81 during the fifteen seasons of his career, which can be extrapolated to display a 0.19 CPS. Jordan peaked between the 1989 and 1991 seasons, during which he maintained title odds around 31%, cementing his status as the greatest peak player in league history.

    [3] Conclusion

    The most important and sole constant to retain during G.O.A.T. or B.O.A.T. or “MVP of all-time” discussions is that there is neither a correct nor incorrect answer. Advanced statistical models including APM and CORP don’t paint a definitive picture of a given player’s value but strongly estimate it, through which grounded decisions are still drawn. Additional and varying evidence can be interpreted as stronger value components, which begets the variance in criteria (e.g. the balance of longevity and peak). The determination of Michael Jordan as the most valuable player in league history is one viewpoint on the topic using a singular rationale. Foremost basketball questions including the “MVP of all-time” discussion are intentionally open-ended to account for the differences in modeling to incorporate new rationale when it comes to view. Despite the multidimensional options to answer the aforementioned question, the employment of the preceding criteria results in a singular point of optimal player value: Michael Jordan.