Category: NBA


  • Lessons From Stat-Tracking (Volume 1)

    Lessons From Stat-Tracking (Volume 1)

    Counting statistics are a traditional and necessary part of player evaluation. They quantify tendencies in ways more effective than any impact metric or eye-test could do. However, there’s a widespread phenomenon that has led some to believe the box score captures a player’s value to his team, which has questionable validity. Regardless, the more a counting stat indicates toward a player’s impact, the more valuable its consideration should be. Traditional box score stats don’t fit the archetype. (I tested the explanatory power of six sets of three-year box score profiles to three-year luck-adjusted RAPM, which held an R^2 of 0.44, suggesting the box score is not as strong an indicator of a player’s value as most would think.) Play-by-play and tracking data move the needle, but a lot of these stats are either deep underground, proprietary, or lack the context to truly reflect a player’s given skill.

    I’ve stat-tracked in less intensive manners in the past, but the sample sizes limited the applicability outside of player evaluation (which still requires a lot of mental filtering). My second initiative in the field plans to yield far more useful results to not only identify statistical trends and expand our knowledge of how different stats relate to impact, but to dispel a common myth among the analytics community: the scoreboard is a perfect indicator of a player’s value. I once believed a “true” form of Adjusted Plus/Minus (APM), meaning perfect coefficient estimates and stability, would be the theoretical end-all-be-all to measure impact on a team. That changed when I started to rewatch certain possessions over and over again and inadvertently gained a deeper understanding of how frequently luck plays a part in basketball. 

    It was mere fortuity (and luck) the first player I did a rigorous stat-track for was Russell Westbrook. His style of play was a perfect framework to explain the effects of luck and how the scoreboard doesn’t reflect the value of certain possessions. Multiple times during his debut with the Wizards against the 76ers, Westbrook would provide a wagered form of help defense. He’d often cover a perimeter assignment near a corner while one of Philadelphia’s big men would post up (usually Embiid). Westbrook would abandon his man to rush over to the opposite block and swipe for the ball. Perhaps there is some merit to this decision, which blocks off the more efficient shot. But more often than not, the big wouldn’t have been in a distinct position to score, or even in an effective spot. If Embiid managed to pass out to Westbrook’s left assignment, the latter would have an open shot. If the shot is successful, it would represent Westbrook’s defensive action: having opened a field-goal attempt for the opposition. (Another way to think of such an event is allowing the other team an opportunity created on poor grounds.)

    However, court actions don’t always have their intuitively-valid impacts (e.g. Westbrook leaving an assignment for a poor double-team will generally have a negative effect) reflected by the scoreboard. If Westbrook performed the same defensive action and his assignment missed the open field-goal attempt, he’s credited with having been on the floor when a shot was missed, thus inflating his defensive impact on the game score. To reverse some of these mislabeled possessions, I expanded the defensive box score to include “defensive errors,” an umbrella term that also stores several other statistics to categorize actions. Defensive errors, as of now, fall under one of the following terms:

    • Missed rotation
    • Blow-by
    • Steal gamble
    • Foul committed*
    • Miscellaneous

    * not in the fourth quarter for the purpose of getting the leading opposition to the free-throw line

    Missed rotations are fairly identifiable. If a teammate makes a justified switch and the given player doesn’t counteract, he’s credited with a missed rotation. Blow-bys are simply when a player’s matchup is given an easy path to the basket due to poor man defense or a lack of attentiveness. (It’s important to distinguish between “matchups” and “assignments.” From here on out, a “matchup” refers to the opposing player a given player is guarding while an “assignment” is the opposing player a given player was expected to guard at the start of a possession, barring any switches. For example, when Westbrook left his “assignment” (the perimeter player) to guard Embiid, the “matchup” switched from the perimeter player to Embiid while the assignment remained constant.)

    A gamble for a steal is one of the more ambiguous stats to track because of how different scorekeepers could interpret them in different ways.

    Fun fact: similar to baseball’s “park factors” that account for ballpark dimensions and other confounding variables in setting, basketball has “court factors” that account for the variance in scorekeeper tendencies. The most common application of court factors is to normalize assists, a stat very subjective in its official definition, to compare them more accurately across teams.

    For the purpose of the exercise, I would constitute a gamble for a steal as an attempt that was 1) not in a face-up guarding scenario or 2) a situation in which the defender had evidently low odds to induce a turnover based on his position relative to the matchup and the basketball. Westbrook accounted for several “reach-around” steal attempts in which his matchup would be in front of him, yet the gamble was performed. This is a perfect example of gambling for a steal. Jumping a passing lane is a more complex scenario. Westbrook didn’t have any significant examples of such an event in his seasonal debut; however, I planned to identify a gamble based on the defender’s footwork. If his natural reaction was to launch downcourt for an easy layup, he was using a high-risk, high-reward style while a defender who firmly plants his feet to prevent a lost ball on the attempt makes a “safer” attempt to steal. 

    Because I hadn’t categorized every possible defensive error preceding my stat-tracking, I used a “miscellaneous” option to sort any court actions that were clear defensive errors that didn’t fit under any of the categories. Westbrook committed four “miscellaneous” defensive errors in the game, including a possession in which he attempted to rebound an airball from the opposition. He changed his mind halfway through the jump and tried to avoid contact to let the ball roll out of bounds, but he’d managed to make slight contact. You could argue that because Westbrook had the ball in his hands the error was committed on offense; but in such cases, the offensive player has yet to fully gain secure possession of the ball. The second was a fairly standard error that would likely happen often enough to make its own category: poor hustle. Westbrook showed lazy coverage in a fastbreak for Philadelphia, which led to an open man on the run, increasing the odds of poorer defensive coverage for Washington, and therefore higher odds of giving up a shot.

    Missed assignments are another assist-like stat that conforms to the mind of the scorekeeper. My definition of a missed assignment is when a player attempts a double (or triple, etc.) team that leaves his assignment in a blatantly-clear position to score. The earlier example of Westbrook covering Embiid would be a good example of a missed assignment. The fourth type works tangentially to the rotations category. Rather than making or missing a correct rotation, a “poor rotation” is when a player makes a rotation with a negative marginal value (for example, when a player rotates onto the wrong matchup and puts the opposition at better odds to score). With a measure of defensive errors, I could track how luck plays a role in scoreboard-oriented metrics with a stat called “defensive error percentage,” or how likely a player is to commit a defensive error in a given possession. It’s simply the sum of all a player’s defensive errors from a given period divided by the number of possessions in which they played.

    The value of defensive error percentage is how it provides a clearer picture of defenders whose scoreboard impact doesn’t reflect the value of their court actions. Take Hassan Whiteside of the Sacramento Kings as an example. He’s generally seen as one of the most error-prone defenders in the league, but his defensive impact metrics are quite good. The confounding variable in this equation is luck (as well as Whiteside being an elite shot-blocker). A greater understanding of his defensive value comes from a more comprehensive box score rather than an assimilation of steals and blocks. As mentioned earlier, Westbrook tends to gamble on steals and make some questionable rotations, so we can use his defensive error rate as a reference. Listed below are his total error percentage on defense and the proportions that come from each type:

    • Defensive Error Percentage: 16.4%
    • Missed Rotations: 27.6%
    • Blow-bys: 13.8%
    • Gambles: 17.2%
    • Fouls committed*: 13.8%
    • Miscellaneous: 27.6%

    With this data, I could also measure the success rate of Westbrook’s rotations. Although he’s a fairly troubled defender in general, his role as a coordinator is underrated. Throughout the game, he would continuously direct teammates to correct new matchups and organize the floor to counteract Philadelphia’s offensive schemes. Westbrook successfully executed 88.9% of his potential rotations. 

    The remaining defensive stats I tracked were “defensive usage” and opponent efficiency. Defensive usage is simply the percentage of possessions in which a given player’s matchup either attempted a field-goal, went to the free-throw line due to a foul from the measured player, or turned the ball over (the turnover has to be induced by the measured player). It gives additional context to a player’s defensive role to provide a better statistical tool to measure a player’s involvement in a defense. It’s the counterpart to the offensive version known as usage percentage. Westbrook had a “defensive usage” of 13.1% in the 2021 season opener. I consider my definition of opponent efficiency far more indicative of a player’s ability to affect field-goal attempts than, say, defensive field-goal percentage. My form uses effective field-goal percentage to measure the points a player allows (you’d rather concede a two than a three) and tracks the matchup rather than the assignment because players aren’t often guarding their assignment at the end of each possession. Westbrook allowed an effective field-goal percentage of 54.5% in the tracked game, which would place a few ticks higher than the expected league-average in the stat this season.

    A strong emphasis was placed on defense in the exercise because of the lack of true defensive measuring tools in the form of counting statistics, but it would be unwise to ignore any offensive counterparts. The most important stat I tracked was “opportunities created,” a concept formed by Ben Taylor nearly ten years ago. Similar to assists, an opportunity created has vague criteria, with biases likely occurring from person to person. Taylor roughly defined as drawing the defense in such a manner that creates either 1) an open field-goal attempt, 2) a clear opportunity for a “hockey” assist (pass that leads to an assist), 3) drawing a foul at the rim, or 4) an offensive rebound followed by a putback. I had one major philosophically qualm with the definition he gave because, more specifically, the last two events do not always result in an opportunity created. A foul at the rim and a putback that directly follows an offensive rebound can each be contested by a single defender only, which leaves all teammates (of the offensive player) accounted for by a defender. Therefore, my definition of an “opportunity created” was simply when the defense was tugged by a player in such a manner that a potential field-goal attempt was opened.

    There was one more phenomenon to be accounted for in designating a created opportunity. When a player is located at a corner with the ball in his hands, especially one of significant shooting prowess, the weakside help will often leave space between their matchups. This distance is just enough for the defender to rush back in time to contest a shot if the assignment were to be passed to, but enough that the latter would have an open shot if the ball were immediately placed in his hands. Therefore, I was targeting “significant” defensive manipulation, which I defined as any defensive positioning that created an opportunity that also contradicted any “natural” movement. This meant players opened by the loose guard of weakside defenders wouldn’t be credited as an opportunity created. Despite a narrower definition, this stat wasn’t easy to track. It’s not always clear which player created which shot, which is a large reason for my gratitude toward pause-and-play buttons. Tracking opportunities created is similar to crediting assists; close calls are decided by your best judgment. 

    A large part of my criteria on these tougher calls would be to observe the body language of the defense. Weakside defenders could stray farther away from their assignments, but if they exhibit clear attention to the assignment, then there’s no opportunity created. If the defender distinctly abandons the assignment to move toward the measured player, then it’s an opportunity created. A lot of these scenarios can be told by the defender’s eye movement (are they watching both the assignment and the handler?) and how they shuffle their feet (is there a continuous movement to one side or does it resemble more of a back-and-forth motion?). Opportunities created were difficult to identify at first (I had to watch the entire first quarter three times over to get in rhythm), but eventually, the motions and reactions of defenses become more and more clear. As I accrue enough games to build a sufficient and diverse sample size, I may build a regression model that approximates the number of opportunities created for a player, similar to Taylor’s “Box Creation” metric. 

    My secondary tracking technique on offense was to grade a player’s passes on the one-to-ten scale seen in Backpicks‘s “Passer Rating” metric. Similar to a metric that approximates opportunities created, I’ll eventually construct a counterpart for passing ability to solely measure the quality of a player’s passing. I wouldn’t recommend grading passes to the more inexperienced watchers, but as you watch more and more game film and use more lenient criteria (I used increments of one), then the process becomes relatively easy. Passing quality was perhaps the most intriguing stat to track because of how unstable it can be from pass to pass.
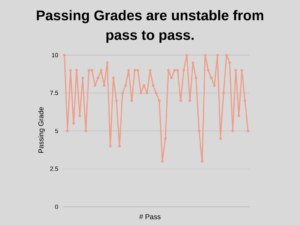
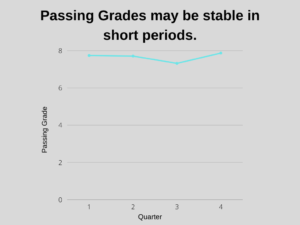
    The variability on a “per pass” basis was expected, especially for a player like Westbrook. He’s one of the very best in the world, but sometimes he’ll throw some loose cannons. A detail I needed to work out as I tracked more and more passes was to choose between bases for a potential regression model. I could take full-season samples, but it worth exploring the potential of explanatory power on a per-game basis. After all, some players have great passing games and then have poor passing games; statistics taken from the individual games may hold some merit against passing grades. I also chose to track the change in the tracked statistics from quarter to quarter, and the consistency of his passing grades was uncanny (Westbrook played roughly equal playing time during each quarter).
    My plan for the future is to track all of Westbrook’s (my favorite player) games and samples of the league’s stars (for an end-of-season ranking). I may try to extrapolate game logs for players to fit a full-season estimate, although the room for error would be high. It all depends on how stable the stats are from game to game. The 2021 season is still very young, and even after hours upon hours upon hours of intensive stat-tracking, there is still a lot of room for exploratory work.

    Listed below are a few interesting stats that stood among the first few games of the 2021 season:

    • Russell Westbrook passed the ball sixty-one times versus Philadelphia, nearly 170% of LeBron James’s activity versus the Clippers
    • Kyrie Irving’s sixteen defensive errors vs. Golden State on opening night, a mark only contested by Russell Westbrook versus Philadelphia (14)
    • Russell Westbrook’s thirty-two made switches and rotations versus Philadelphia
    • And the most impressive of them all, Stephen Curry’s twenty-nine opportunities created versus Brooklyn

    Edited note: a few comments on my exact definition of a “rotation” for the purpose of stat-tracking

    • When a player is distinctly covering one matchup and opts for a new one for the purpose of preventing penetration and/or a shot opportunity.

    • If it’s simply a two-man switch to make a small change in coverage, especially on the weak side, it’s not really a rotation.

    • I wanted to loosen the definition enough so that it captures a player’s awareness and movement, but strict enough so that a meaningless switch of sorts isn’t counted.
  • Stephen Curry | 2016 Evaluation

    Stephen Curry | 2016 Evaluation

    “Stephen Curry in 2016 is more fun than anything, maybe ever…” – SLATE

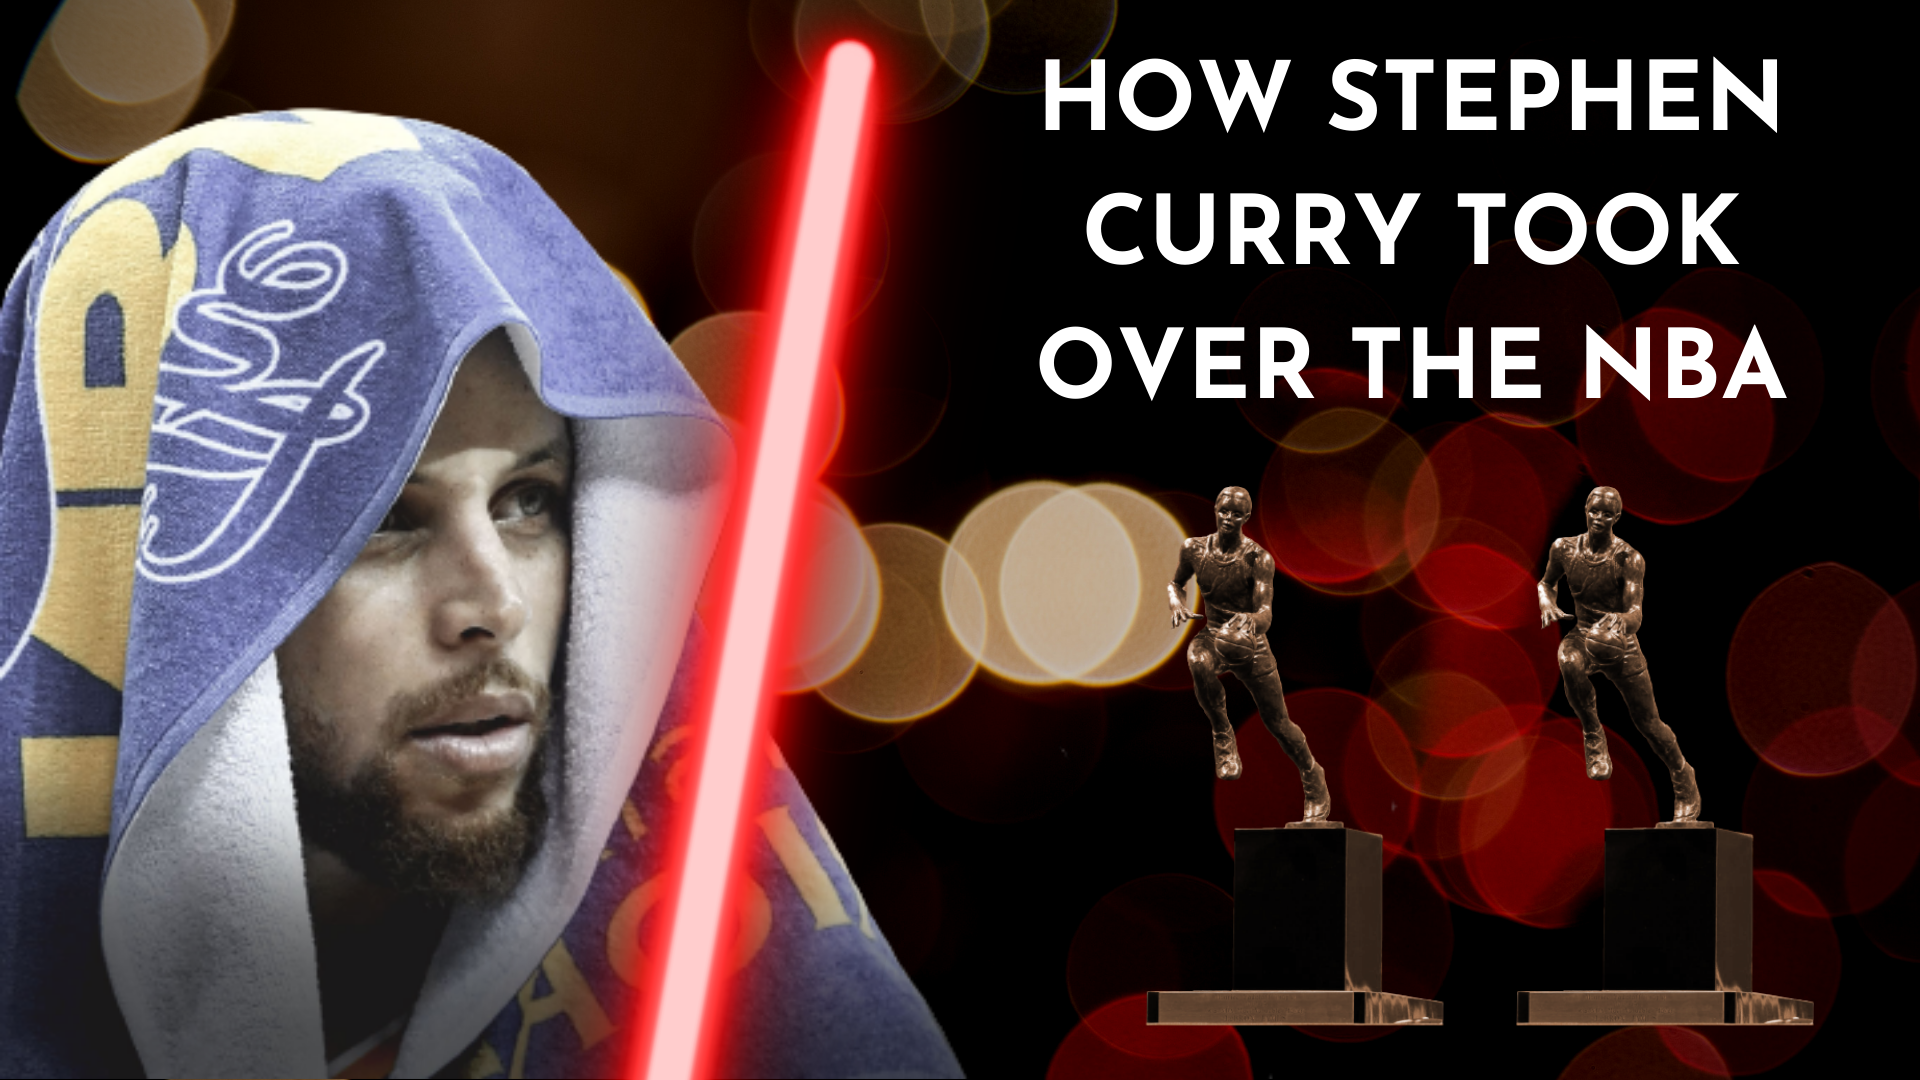
    The greatest point guard of the century set the Bay Area into a Warriors frenzy with his electric three-point scoring and the team’s dynastical tendencies, with records being broken left and right. Curry’s season may have been highlighted by 402 three-pointers made and a unanimous MVP, but very few people knew how good he actually was that year, even those living in the eye of the storm. He entered rarefied air in his ’16 season, and no player since then has yet to match it. But exactly how good was he when he was drilling half-court shots seemingly at will? With Curry’s evaluation, I’ll try to answer a long-thought question: was Curry’s 2016 campaign the greatest offensive season in league history?

    Scoring

    Curry’s scoring alone took Golden State’s offense to dynastical levels. During possessions in which he attempted to score, defined as either a true shooting attempt or a scoring turnover, the Warriors posted an offensive rating of 127. That was a whopping +21 relative offense, and there’s potent evidence behind a figure of such a magnitude.

    Due to Curry’s historical outside shooting, his inside scoring received far less recognition despite being one of the skill’s best. Among players who played for more than a thousand minutes, Curry was thirteenth in field-goal percentage on drives; which, considering his 6’3″ stature, is geometrically more masterly. A part of Curry’s surprising prowess in the paint was his strength; according to CBSSports, he could deadlift 400 pounds in the summer of 2016, a mark no Warriors could top except for the 6’11”, 255-pound Festus Ezeli. Paired with a solid motor, Curry was able to penetrate defenses with relative ease.

    He was a very prolific paint scorer, having taken 22.5% of his attempts from within three feet of the basket. With respect to Curry’s three-point barrages and smaller stature, his frequency was unexpectedly high. He was also able to capitalize on these high-efficient looks at a 69.6% clip, strikingly greater than the league-average of 62.4%. Curry would often opt for these shots to avoid double teams on the perimeter, swinging around the arc, and finding an angle to drive. His size and vertical leap alone weren’t enough to dominate defenses in the post, so during his forward-facing drives, Curry would either go take an early step to gain ground against the opponent or his premier center of gravity. Learning to take the toll of movement with his hips instead of his ankles truly unlocked Curry’s greatest interior capabilities.

    The other component to his elite finishing was Curry’s ability to split defenses. As the greatest shooter ever, he also became the most gravitational player ever. He’d rarely not see multiple defenders in his periphery when operating on the perimeter, yet it was never destabilizing. If two defenders went on either side of Curry, he’d split their position with surprising quickness and agile lateral movement. The aforementioned utilization of his hips allowed him to change direction with fast pivots, which often left defenders in the dust. Curry was one of the league’s best paint finishers, and it was the weak point of his scoring résumé.

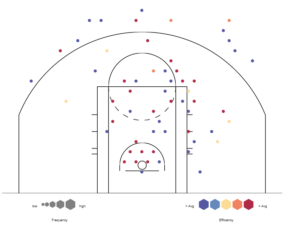
    Everywhere outside the paint was Curry’s domain… not that the paint wasn’t already his in some form either. He stuffed the stat sheet with a collection of absurd shooting scores that paint an extremely flattering picture of Curry’s outside scoring, a strong point of which was how he and his teammates set up his scoring. Curry was one of the most efficient catch-and-shoot scorers in the league that year (68.6 eFG%), only behind J.J. Redick for players who took more than 400 catch-and-shot field-goal attempts. However, contrary to the traditional tendencies, Curry’s efficiency didn’t rapidly decline on non-assisted attempts. He was the league-leader in effective field goal percentage on pull-up shooting (61.9%) for players with more than nineteen attempts. For reference, Curry took 687 of these attempts. The next most-efficient player to even take one hundred, D.J. Augustin, shot 54.3%.

    Curry wasn’t an “opportunist,” as many primarily catch-and-shoot scorers are. He was a master schemer, consistently creating his own shot while also being an elite catch-and-shoot scorer. 37% of Curry’s two-point field-goals were of teammate assists, significantly lower than the league-average of 51%. From three-point range, his figure is 55%, a large decrease from the league-average of 84%. It’s probable Curry’s scoring would’ve been more scrutinized if he were the product of a system in which he was set up for high-quality attempts by teammates more than himself, although this wasn’t the case. Curry’s status as an offensive engine wasn’t exactly in question, but the rates at which he creates his own field-goals further the idea that he was a peak offensive player during his second MVP season.

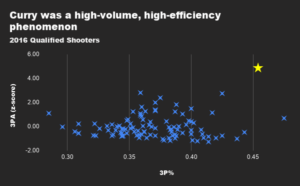
    No player has yet to match the historical contributions of Steph Curry’s outside scoring. He attempted a mind-boggling 886 three-point shots during his 79 games played, nearly 230 more shots than the second-place finisher in the stat (James Harden). Curry was surprisingly second in efficiency (45.4%), trailing only behind the Clippers’ J.J. Redick. However, Curry attempted more than double of Redick’s shots on far greater self-reliance, which suggests from an all-things-considered outlook, Curry was the most efficient three-point shooter in the league. Using the league-average three-point percentage as a relative comparison, Curry added 265.8 net points to the scoreboard through his three-point attempts alone. The efficiency and volume at which he made three-point shots make Curry’s ’16 significant in league history as the greatest outside scoring season ever.

    Yellow star denotes Curry

    The Baby-Faced Assassin had not only the greatest scoring season of the year (leading the league in both scoring rate and true shooting percentage, as well as being the only player to ever win the scoring and efficiency titles) but the history of basketball. Curry leads the all-time leaderboard in Backpicks‘s ScoreVal metric as well as (in theory) my own of similar nature: Scorer Rating. Given the circumstances of his scoring, and how his greater self-dependence is an indicator that his scoring statistics are more reflective of his true abilities than the average “opportunist,” it’s fair to say Curry had the strongest scoring peak of any player in league history. As the thirty-first highest peak in relative true “scoring” percentage (which uses a scoring turnover) estimates as a scoring attempt and the eleventh-highest peak in scoring rate with historic frequency, Curry’s mix of volume and efficiency was unprecedented.
    Off-Ball / Movement

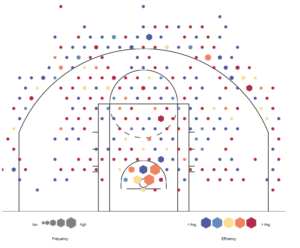
    The next trip up Curry’s sleeve, and a large contributor to his assisted shots, was his world-class movement without the ball in his hands. An overlooked skill when it comes to an elite offensive player, Curry’s not often recognized for it compared to his eye-popping distance shooting. Fortunately, he was able to put it to good use as a member of the Warriors, a team with some of the most dynamic ball movement ever, comparable to the ’96 Chicago Bulls. Curry was a threat all over the court without the ball, keeping defenders on their toes with his presence alone.

    With the point guard duties he had, Curry would often start his off-ball stints at the top of the perimeter. He would primarily target either the corners or the paint, two of his most efficient ranges. To do so, Curry would often make slow rotations to a corner and let his teammates go to town. These made up a lot of Curry’s “excluded” possessions, but his positioning in these spots was another outlet for shot creation. He’d sometimes feign a backdoor cut to unclog a lane in which a teammate could drive: phenomena that would occur either starting at a corner or up top. Significant credit for this is due to his creation instead of his off-ball capabilities, but the grace and effectiveness with which Curry could feign cuts was extraordinary.

    Aside from his creation abilities off the ball, Curry’s movement itself rivals the all-time greats in the skill. He has a reputation for a game that doesn’t require the athleticism most do, but the quickness in his routes is a product of a strong physical foundation. The excess training of his hips provided an easier way for Curry to reposition himself on drives, otherwise known as changing direction. It’s how he gave a seasonal montage of possessions in which he was driving to the hoop and swiftly stepped back, showing an uncanny tendency to lose his defenders. Curry was by no means screen-reliant, but his ability to weave in and out of teammate screens and opponent setups was the boost he needed to improve his self-creation off the ball.

    Playmaking

    Even if Curry were a pedestrian scorer, his passing and creation would’ve kept him afloat as an offensive engine. The quality of his passing wasn’t the focal point of his playmaking, and the skill is accurately represented by his Passer Rating per Backpicks. Since his breakout ’13 campaign, the metric has graded him in the mid-to-high-sevens on the one-to-ten scale. A lot of his assists were products of his elite vision, which made him especially aware of the corners. With five teammates who shot higher than 40% on corner threes, a lot of these passes were tailored to Golden State’s roster. Curry was additionally proficient at splitting defenses with his quick bounce passes. A common trait among elite playmakers, he refined the tactic with his strong hips and vision approaching the hoop en route to his 1,261 points created through assists.

    There wasn’t an excess number of negatives with Curry’s passing. The notable ones include his tendency to overpass against taller defenders. During games against elite defenses (especially the recurring January 15th matchup against the Spurs), he’d find himself picking the ball up early, forcing a pass into the post or out to the perimeter. Defenders like LaMarcus Aldridge and Kawhi Leonard rushed Curry into these passes, and his intentions were clear: to avoid the long arms of his defenders and skip a pass to an open teammate. However, Curry would often underestimate the launch angle of these passes, and they’d gain too much ground before their final descent. The same would occur with some of his full-court baseball passes. The main theme with Curry’s passing deficiencies was that he overestimated the necessary distances for tougher passes, but the lower frequency at which these happened made them minor issues.

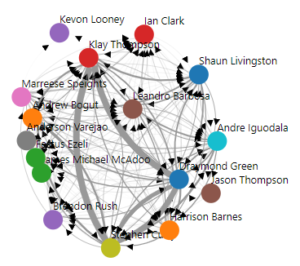
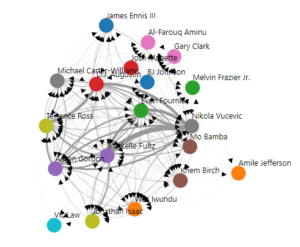
    PBPStats – a condensed version of Golden State’s assist network

    The Warriors were a movement-heavy team, having led the league in assists per 100 possessions by a significant margin (+2.6 assists), secondary assists, and assist points created. The nucleus of this action was made up of the team’s “big three” in Curry, Draymond Green, and Klay Thompson. Curry’s strongest link was with Thompson, to whom he assisted 209 field goals. He also assisted 139 of Green’s shots and 66 of Andrew Bogut’s. Based on the positioning of these players, it’s clear a lot of Curry’s playmaking was focused on or around the perimeter. He averaged 2.5 fewer assists per 100 possessions with his star on the arc, Thompson, off the floor. Curry’s playmaking was understated that year because of how many more shots he was taking (+3.5 more attempts per 100 from the previous season); but even then, his playmaking value was near the top of the league. Golden State’s passing and Curry’s efficient teammates counteract some of that deflation, but the confounding variables almost seem to cancel themselves out.
    Defense

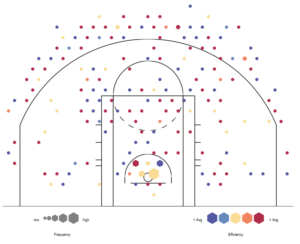
    Curry is often criticized for his man-to-man abilities, and there’s some truth to that. He wasn’t the greatest at positioning himself, keeping a naturally flat-footed and unathletic stance. Curry had solid hands in these spots, covering higher and lower passing angles with either arm, although his 6’4″ wingspan made it slightly harder to effectively clog passing lanes.

    Among his more potent errors include mispositioning; he’ll sometimes miss a matchup entirely, the only other main instance of this being a tradeoff of his good rebounding. Curry would often lose his man positioning himself for the defensive rebound. This does make it a bit of a gamble, but the generally-high defensive rebounding percentages among teams (league-average 76.2%) made it so that only a small percentage of possessions would see these fallbacks. But Curry was a surprisingly good rebounder for his height, having grabbed 4.9 defensive rebounds per 75 possessions at a 2.9% clip, suggesting it was the best defensive-rebounding season of his career. 

    Curry’s small frame made it hard for him to stay in front of stronger matchups, so he’d sometimes be left in the dust on defensive possessions (just as he did to the NBA’s very best defenders). Ironically, Curry was given a taste of his own medicine in these stints. He was similarly susceptible to screen action, fizzling his entire value out against stronger defenders by entirely losing his man. The strongest positive of his man-to-man game is his ability to maintain space with his matchup. Curry can string together good defensive possessions when his matchups are moving laterally, keeping close but safe gaps between them and himself. He also has half-decent hands, which allowed him to break up plays in and near the radius of his wingspan. His transition coverage and fallback play provided a lot of unseen value for the Warriors, keeping offensive matchups at bay and preventing an underestimated number of field-goal opportunities.

    Impact metrics painted a consistent picture of Curry in which he was a positive defensive player. He was generally favored by more play-by-play infused and non-box metrics, with defensive scores higher than a point in PI RAPM (+1.7), PIPM (+1.47), and RAPTOR (+2.78). Although, box-oriented metrics showed him some love too, with a +1.6 score in the defensive component of Basketball-Reference‘s Box Plus/Minus model. The lowest of Curry’s defensive impact metrics was his single-year “luck-adjusted” RAPM (-0.07), which painted him as a minor negative. The aggregate of Curry’s scores suggest his defense was a clear positive to his team on the defensive end, and without any confounding variables to drastically alter the results, it’s fair to say impact metrics give strong portraits of him on that end.

    Summary

    With Curry’s evaluation under wraps, there’s now a fairer picture as to where his offense stands on the historical leaderboards. His world-class combination of scoring volume, efficiency, playmaking, and off-ball movement, paired with peak scalability, makes it hard to say his claim for the sport’s peak offensive season is rivaled by anyone not named Michael Jordan. Given the hindrances of Jordan’s impact from his more questionable portability, I’d deem Curry’s second MVP campaign as the greatest offensive season in league history. With his mild-positive defense in the equation, using my updated “Championship Probability Added” calculator, I’d estimate Curry would’ve provided a random team with a 10.2% increment to win the title. (Note: the percent increments will be significantly lower than previous evaluations because the calculation now considers impact on below-average teams.) His full-strength title odds would clock in at about 11.7%, which would rank as one of the fifteen best seasons of all-time.


  • Which is More Important in Scoring: Efficiency or Volume?

    Which is More Important in Scoring: Efficiency or Volume?

    The “efficiency versus volume” conversation is a classic today, but very few attempts have been made to provide a clear answer. Most recently, Backpicks developed its “Scoring Value” metric (abbreviated “ScoreVal”) to presumably estimate the net impact of a player’s scoring every 100 possessions. The stat alone was a success, but a more definitive solution to the “efficiency versus volume” argument was still blurry. Today, I’ll give my best attempt at settling the historic debate to determine the more important aspect of scoring between efficiency and volume.

    A way to go at this is at the team level: plotting the relationship between points per game (as volume neglects attempts/”pace”) and true shooting percentage. We’d use TS% in place of, say, points per possession (the truer measure of offensive efficiency) because we’d need to use the latter as the response variable; otherwise, efficiency correlation would be perfect! Using 2020 values, points per game holds a correlation coefficient of 0.78 and true shooting holds one of 0.75. The difference is very close, and given the sample size, it’s not enough to draw a conclusion. Plus, 2020 has about as many confounding variables as any other season (COVID-19, stoppage, no access to courts at times). Paired with the concerns of the chosen variables, it’s likely that the team level won’t settle the discussion. 

    The next way to approach a conclusion is on the player level. Between scoring rate in points per possession and true shooting percentage, which holds a stronger correlation with how “productive” a player is as a scorer? This is a question long thought of without a widespread solution. To answer this, I developed a statistical model that measures the number of net points a player adds through scoring, which I’ll name “Scorer Rating” (I’m open to name suggestions).

    Can a player’s scoring impact on the scoreboard be summed up in a single number?

    Points per possession at the team level epitomizes scoring efficiency because it redefines “scoring attempts.” TS% uses shooting attempts as the divisor, but in reality, shooting attempts aren’t the only chances a player or team is given to score. If a player commits a turnover, his team will be credited with a “scoring attempt” on that possession; because, although they weren’t given a chance to shoot, they had a chance to score that was blown. Therefore, we want to use a new measure of “scoring attempts” for players in a similar manner. To do this, I borrowed a technique from ScoreVal, which classifies turnovers as either playmaking or scoring turnovers. The model designates these turnovers based on the percentages of a player’s “offensive load” (involvement) that come from playmaking and scoring. However, this estimator provides imperfect measures when there are equitable alternatives. I used an idea discussed in the metric’s inaugural post, which designates all turnovers not committed by bad passes (per Basketball-Reference‘s play-by-play data) as “scoring turnovers.”

    With a measurement of how many turnovers negated the value of a scoring possession, I could now replicate a truer scoring efficiency on the player level. For example, in his historical 2016 campaign, Stephen Curry averaged 1.34 points per true shooting attempt. Add in his non-bad pass turnovers, 95, to the divisor, and he averaged 1.27 points per “scoring possession.” This means on possessions in which Curry attempted to score, the Golden State Warriors had an offensive rating of 127; that would be a +21 rORtg! The next step is to set a player’s new efficiency relative to the league-average. Curry’s 1.27 points per scoring possession compared to the average of that season, 1.04, means he added 0.267 points per possession relative to the league. From there, it’s a measure of how often a player attempts to score per game, normalized to 100 possessions per 48 minutes. For example, Curry accounted for 23.7 scoring possessions per game in 2016, but his team played at a 99.3 pace, so his attempts receive a slight boost.

    The raw number of net points Curry provided through scoring was the product of his efficiency and attempt frequency, which clocked in at 6.4 points, by far the highest mark in the NBA that year. After all, he led the league in volume and efficiency that year! However, the league-average was slightly higher than zero, around 0.1 points. Therefore, Curry added 6.2 points above the league’s average that season. The last confounding variable was playing time. Rakeem Christmas, the most notable example, had a Scorer Rating of 1.9 points, which ranked in the top-10, despite having only played six minutes the whole year. The last adjustment was using the binary logarithm of a player’s total minutes played as the “x” in an augmented sigmoid function to regularize abnormally high scores from limited playing time. Christmas’s “adjusted” Scorer Rating was then 0.6 points. 

    Listed below are all player-seasons for Scorer Rating since 2016.

    PlayerSeasonTmScRate
    Stephen Curry2016GSW6.2
    Stephen Curry2018GSW4.9
    Kevin Durant2016OKC4.2
    Kevin Durant2017GSW4.1
    Damian Lillard2020POR3.8
    Isaiah Thomas2017BOS3.7
    Stephen Curry2019GSW3.7
    Kevin Durant2018GSW3.5
    Stephen Curry2017GSW3.3
    James Harden2018HOU3.2
    James Harden2019HOU3.2
    Kawhi Leonard2016SAS3
    Kevin Durant2019GSW3
    J.J. Redick2016LAC2.9
    Karl-Anthony Towns2018MIN2.9
    LeBron James2018CLE2.9
    John Collins2020ATL2.9
    James Harden2016HOU2.8
    Kawhi Leonard2017SAS2.8
    James Harden2020HOU2.8
    LeBron James2017CLE2.7
    Kyle Lowry2017TOR2.7
    Anthony Davis2018NOP2.7
    Karl-Anthony Towns2020MIN2.7
    Klay Thompson2016GSW2.6
    Karl-Anthony Towns2017MIN2.6
    Kyrie Irving2018BOS2.6
    Danilo Gallinari2019LAC2.6
    JaKarr Sampson2019CHI2.6
    MarShon Brooks2018MEM2.5
    LeBron James2016CLE2.4
    James Harden2017HOU2.4
    Bradley Beal2017WAS2.4
    Damian Lillard2018POR2.4
    Duncan Robinson2020MIA2.4
    Danilo Gallinari2017DEN2.3
    Damian Lillard2017POR2.3
    Giannis Antetokounmpo2019MIL2.3
    Rudy Gobert2019UTA2.3
    Clint Capela2019HOU2.2
    Kawhi Leonard2019TOR2.2
    Mike Conley2017MEM2.1
    Otto Porter2017WAS2.1
    Rudy Gobert2017UTA2.1
    Rudy Gobert2020UTA2.1
    Anthony Davis2020LAL2.1
    Mitchell Robinson2020NYK2.1
    Klay Thompson2017GSW2
    Nikola Jokić2017DEN2
    Gordon Hayward2017UTA2
    DeAndre Jordan2017LAC2
    Chris Paul2017LAC2
    Damian Lillard2019POR2
    Dāvis Bertāns2020WAS2
    Devin Booker2020PHO2
    J.J. Redick2020NOP2
    J.J. Redick2018PHI1.9
    Jimmy Butler2018MIN1.9
    Kevin Love2018CLE1.9
    R.J. Hunter2019BOS1.9
    Kyrie Irving2020BRK1.9
    Jimmy Butler2017CHI1.8
    George Hill2017UTA1.8
    Andre Ingram2018LAL1.8
    Klay Thompson2018GSW1.8
    Jonathan Gibson2018BOS1.8
    Clint Capela2018HOU1.8
    Dwight Powell2019DAL1.8
    Anthony Davis2019NOP1.8
    Montrezl Harrell2019LAC1.8
    Khris Middleton2020MIL1.8
    T.J. Warren2020IND1.8
    Richaun Holmes2020SAC1.8
    Danilo Gallinari2020OKC1.8
    Danilo Gallinari2016DEN1.7
    Jae Crowder2017BOS1.7
    Gary Harris2017DEN1.7
    Thomas Bryant2019WAS1.7
    Karl-Anthony Towns2019MIN1.7
    Joe Harris2019BRK1.7
    Brandon Clarke2020MEM1.7
    DeAndre Jordan2016LAC1.6
    Kyle Lowry2016TOR1.6
    Kyrie Irving2017CLE1.6
    Chris Paul2018HOU1.6
    Giannis Antetokounmpo2018MIL1.6
    John Collins2019ATL1.6
    Bojan Bogdanović2019IND1.6
    LeBron James2019LAL1.6
    Kyrie Irving2019BOS1.6
    Pascal Siakam2019TOR1.6
    J.J. Redick2019PHI1.6
    Christian Wood2020DET1.6
    Thomas Bryant2020WAS1.6
    Seth Curry2020DAL1.6
    Damian Lillard2016POR1.5
    Chris Paul2016LAC1.5
    Chris Bosh2016MIA1.5
    CJ McCollum2017POR1.5
    Lou Williams2017TOT1.5
    Montrezl Harrell2017HOU1.5
    Otto Porter2018WAS1.5
    Anthony Tolliver2018DET1.5
    Montrezl Harrell2018LAC1.5
    Malcolm Brogdon2019MIL1.5
    Trae Young2020ATL1.5
    Chris Paul2020OKC1.5
    Keldon Johnson2020SAS1.5
    Lou Williams2016LAL1.4
    Kyle Korver2017TOT1.4
    Paul George2017IND1.4
    Clint Capela2017HOU1.4
    J.J. Redick2017LAC1.4
    DeAndre Jordan2018LAC1.4
    Kyle Korver2018CLE1.4
    Kyle Lowry2018TOR1.4
    Reggie Bullock2018DET1.4
    Rudy Gobert2018UTA1.4
    Gary Harris2018DEN1.4
    Paul George2019OKC1.4
    Norman Powell2020TOR1.4
    Zion Williamson2020NOP1.4
    Hassan Whiteside2020POR1.4
    Dwight Powell2020DAL1.4
    Hassan Whiteside2016MIA1.3
    Karl-Anthony Towns2016MIN1.3
    Jimmy Butler2016CHI1.3
    Enes Kanter2016OKC1.3
    Anthony Davis2017NOP1.3
    Tyson Chandler2017PHO1.3
    Joe Harris2018BRK1.3
    Dwight Powell2018DAL1.3
    Lou Williams2018LAC1.3
    Joe Ingles2018UTA1.3
    Kemba Walker2018CHO1.3
    Darren Collison2018IND1.3
    Mitchell Robinson2019NYK1.3
    Jarrett Allen2020BRK1.3
    Giannis Antetokounmpo2020MIL1.3
    Nikola Jokić2020DEN1.3
    George Hill2020MIL1.3
    Eric Mika2020SAC1.3
    Chandler Parsons2016DAL1.2
    Dirk Nowitzki2016DAL1.2
    Evan Fournier2016ORL1.2
    Darren Collison2016SAC1.2
    Giannis Antetokounmpo2017MIL1.2
    Seth Curry2017DAL1.2
    Enes Kanter2018NYK1.2
    Bojan Bogdanović2018IND1.2
    Danny Green2019TOR1.2
    DeAndre Jordan2019TOT1.2
    Bradley Beal2019WAS1.2
    Buddy Hield2019SAC1.2
    Bojan Bogdanović2020UTA1.2
    Nerlens Noel2020OKC1.2
    Kawhi Leonard2020LAC1.2
    DeAndre Jordan2020BRK1.2
    DeMar DeRozan2020SAS1.2
    Marvin Williams2016CHO1.1
    Carl Landry2016PHI1.1
    LaMarcus Aldridge2016SAS1.1
    C.J. Miles2017IND1.1
    Nick Young2017LAL1.1
    Kemba Walker2017CHO1.1
    Adreian Payne2018ORL1.1
    Tobias Harris2019TOT1.1
    Danuel House2019HOU1.1
    Derrick Favors2019UTA1.1
    D.J. Augustin2019ORL1.1
    Kenneth Faried2019TOT1.1
    Kevin Love2020CLE1.1
    Doug McDermott2020IND1.1
    Montrezl Harrell2020LAC1.1
    Rodney Hood2020POR1.1
    Jimmy Butler2020MIA1.1
    Luka Dončić2020DAL1.1
    Jaxson Hayes2020NOP1.1
    Jonas Valančiūnas2016TOR1
    Anthony Davis2016NOP1
    Michael Kidd-Gilchrist2016CHO1
    Brandan Wright2016MEM1
    Kemba Walker2016CHO1
    Omri Casspi2016SAC1
    Archie Goodwin2017TOT1
    Andre Iguodala2017GSW1
    Jordan Crawford2017NOP1
    Jonas Valančiūnas2018TOR1
    Steven Adams2018OKC1
    LaMarcus Aldridge2018SAS1
    Nikola Jokić2018DEN1
    Jeremy Lin2018BRK1
    Nikola Mirotić2018TOT1
    Wade Baldwin2018POR1
    Taj Gibson2018MIN1
    Khris Middleton2018MIL1
    Dāvis Bertāns2019SAS1
    Jonas Valančiūnas2019TOT1
    Mike Conley2019MEM1
    Nikola Mirotić2019TOT1
    JaVale McGee2019LAL1
    Richaun Holmes2019PHO1
    Jodie Meeks2019TOR1
    Jonas Valančiūnas2020MEM1
    Ben McLemore2020HOU1
    Paul George2020LAC1
    Clint Capela2020HOU1
    Joe Harris2020BRK1
    Jae Crowder2016BOS0.9
    Al Horford2016ATL0.9
    Isaiah Thomas2016BOS0.9
    Boban Marjanović2016SAS0.9
    Allen Crabbe2017POR0.9
    Brandan Wright2017MEM0.9
    Zach LaVine2017MIN0.9
    Channing Frye2017CLE0.9
    Ryan Anderson2017HOU0.9
    Wayne Ellington2018MIA0.9
    Jamil Wilson2018LAC0.9
    Mirza Teletović2018MIL0.9
    Kawhi Leonard2018SAS0.9
    Jarrett Allen2019BRK0.9
    Malik Beasley2019DEN0.9
    T.J. Warren2019PHO0.9
    Landry Shamet2019TOT0.9
    Dwight Howard2019WAS0.9
    Al Horford2019BOS0.9
    Devin Booker2019PHO0.9
    Klay Thompson2019GSW0.9
    Domantas Sabonis2019IND0.9
    Evan Fournier2020ORL0.9
    Garrison Mathews2020WAS0.9
    Daniel Theis2020BOS0.9
    Bradley Beal2020WAS0.9
    Tim Hardaway Jr.2020DAL0.9
    Robert Williams2020BOS0.9
    Damian Jones2020ATL0.9
    Gordon Hayward2020BOS0.9
    Ivica Zubac2020LAC0.9
    Kyle Lowry2020TOR0.9
    Jared Dudley2016WAS0.8
    Marcin Gortat2016WAS0.8
    Brandon Bass2016LAL0.8
    Draymond Green2016GSW0.8
    Troy Daniels2016CHO0.8
    Mirza Teletović2016PHO0.8
    Blake Griffin2017LAC0.8
    Nenê2017HOU0.8
    Josh Huestis2017OKC0.8
    Tony Snell2017MIL0.8
    Myles Turner2017IND0.8
    Marvin Williams2018CHO0.8
    Dirk Nowitzki2018DAL0.8
    Ante Žižić2018CLE0.8
    Darius Miller2018NOP0.8
    D.J. Augustin2018ORL0.8
    Damian Jones2019GSW0.8
    Jerami Grant2019OKC0.8
    Deandre Ayton2019PHO0.8
    Brook Lopez2019MIL0.8
    Jeff Green2019WAS0.8
    Joel Embiid2019PHI0.8
    Doug McDermott2019IND0.8
    Patty Mills2020SAS0.8
    Mikal Bridges2020PHO0.8
    Luke Kennard2020DET0.8
    Derrick Jones Jr.2020MIA0.8
    Larry Nance Jr.2020CLE0.8
    Shake Milton2020PHI0.8
    Tristan Thompson2016CLE0.7
    Khris Middleton2016MIL0.7
    Sean Kilpatrick2016TOT0.7
    Eric Gordon2016NOP0.7
    Paul George2016IND0.7
    Seth Curry2016SAC0.7
    Steven Adams2016OKC0.7
    Michael Beasley2016HOU0.7
    Harrison Barnes2016GSW0.7
    Kevin Love2017CLE0.7
    Pau Gasol2017SAS0.7
    Richaun Holmes2017PHI0.7
    Nerlens Noel2017TOT0.7
    Tim Hardaway Jr.2017ATL0.7
    Evan Fournier2018ORL0.7
    David Stockton2018UTA0.7
    Marco Belinelli2018TOT0.7
    Paul George2018OKC0.7
    Tobias Harris2018TOT0.7
    Malcolm Brogdon2018MIL0.7
    Trey Lyles2018DEN0.7
    Eric Bledsoe2018TOT0.7
    E’Twaun Moore2018NOP0.7
    Larry Nance Jr.2018TOT0.7
    Monte Morris2018DEN0.7
    Josh Hart2018LAL0.7
    Victor Oladipo2018IND0.7
    John Collins2018ATL0.7
    Willie Reed2018TOT0.7
    Jerami Grant2018OKC0.7
    Boban Marjanović2019TOT0.7
    Meyers Leonard2019POR0.7
    Devin Robinson2019WAS0.7
    Nikola Jokić2019DEN0.7
    Jimmy Butler2019TOT0.7
    Langston Galloway2020DET0.7
    Dwight Howard2020LAL0.7
    Michael Porter Jr.2020DEN0.7
    LeBron James2020LAL0.7
    Derrick Favors2020NOP0.7
    Grayson Allen2020MEM0.7
    Tony Snell2020DET0.7
    Allen Crabbe2016POR0.6
    Kyle Korver2016ATL0.6
    James Ennis2016TOT0.6
    Quincy Acy2016SAC0.6
    Manu Ginóbili2016SAS0.6
    Otto Porter2016WAS0.6
    Kevin Love2016CLE0.6
    DeMar DeRozan2016TOR0.6
    Ian Mahinmi2016IND0.6
    Rakeem Christmas2016IND0.6
    JaVale McGee2017GSW0.6
    Cody Zeller2017CHO0.6
    Tobias Harris2017DET0.6
    Brandon Bass2017LAC0.6
    David Lee2017SAS0.6
    Dwight Howard2017ATL0.6
    Wayne Ellington2017MIA0.6
    Jonas Valančiūnas2017TOR0.6
    Goran Dragić2017MIA0.6
    Bojan Bogdanović2017TOT0.6
    Darren Collison2017SAC0.6
    Patty Mills2017SAS0.6
    Jarrett Allen2018BRK0.6
    Eric Gordon2018HOU0.6
    Jrue Holiday2018NOP0.6
    Ryan Anderson2018HOU0.6
    Tomáš Satoranský2018WAS0.6
    Jakob Poeltl2018TOR0.6
    Jayson Tatum2018BOS0.6
    Thabo Sefolosha2018UTA0.6
    Derrick Favors2018UTA0.6
    Omri Casspi2018GSW0.6
    Jamal Murray2018DEN0.6
    JaVale McGee2018GSW0.6
    Quinn Cook2018GSW0.6
    Tyreke Evans2018MEM0.6
    Bryn Forbes2019SAS0.6
    Taj Gibson2019MIN0.6
    Monte Morris2019DEN0.6
    Blake Griffin2019DET0.6
    Marcus Derrickson2019GSW0.6
    Julius Randle2019NOP0.6
    Jakob Poeltl2019SAS0.6
    Rudy Gay2019SAS0.6
    Khem Birch2019ORL0.6
    Deyonta Davis2019ATL0.6
    Cameron Payne2020PHO0.6
    Matt Thomas2020TOR0.6
    Jerami Grant2020DEN0.6
    JaVale McGee2020LAL0.6
    Daniel Gafford2020CHI0.6
    Gary Trent Jr.2020POR0.6
    Cheick Diallo2020PHO0.6
    Tony Bradley2020UTA0.6
    Derrick White2020SAS0.6
    Kemba Walker2020BOS0.6
    Sindarius Thornwell2020NOP0.6
    Russell Westbrook2016OKC0.5
    Kenneth Faried2016DEN0.5
    Dwight Howard2016HOU0.5
    Nikola Jokić2016DEN0.5
    Jerryd Bayless2016MIL0.5
    Ed Davis2016POR0.5
    Brook Lopez2016BRK0.5
    Greg Monroe2016MIL0.5
    José Calderón2016NYK0.5
    Eric Bledsoe2016PHO0.5
    Tobias Harris2016TOT0.5
    Andrew Bogut2016GSW0.5
    J.R. Smith2016CLE0.5
    Doug McDermott2016CHI0.5
    Cody Zeller2016CHO0.5
    Gordon Hayward2016UTA0.5
    Trevor Ariza2016HOU0.5
    Enes Kanter2017OKC0.5
    David Nwaba2017LAL0.5
    Jabari Parker2017MIL0.5
    JaMychal Green2017MEM0.5
    Edy Tavares2017TOT0.5
    Khris Middleton2017MIL0.5
    Dante Cunningham2017NOP0.5
    Brook Lopez2017BRK0.5
    Amir Johnson2017BOS0.5
    Anthony Tolliver2017SAC0.5
    Dwight Powell2017DAL0.5
    José Calderón2018CLE0.5
    Bradley Beal2018WAS0.5
    Tyson Chandler2018PHO0.5
    Gerald Green2018HOU0.5
    Dario Šarić2018PHI0.5
    Alex Len2018PHO0.5
    Courtney Lee2018NYK0.5
    Deyonta Davis2018MEM0.5
    Trey Burke2018NYK0.5
    Troy Daniels2018PHO0.5
    Dāvis Bertāns2018SAS0.5
    Trevor Ariza2018HOU0.5
    Terrence Ross2019ORL0.5
    Nikola Vučević2019ORL0.5
    Dewayne Dedmon2019ATL0.5
    Kevon Looney2019GSW0.5
    Spencer Dinwiddie2019BRK0.5
    Cody Zeller2019CHO0.5
    Seth Curry2019POR0.5
    Scott Machado2019LAL0.5
    Miles Plumlee2019ATL0.5
    Wayne Ellington2019TOT0.5
    Maxi Kleber2020DAL0.5
    David Nwaba2020BRK0.5
    Nemanja Bjelica2020SAC0.5
    John Konchar2020MEM0.5
    Kentavious Caldwell-Pope2020LAL0.5
    Kyle Korver2020MIL0.5
    Isaiah Hartenstein2020HOU0.5
    Dorian Finney-Smith2020DAL0.5
    OG Anunoby2020TOR0.5
    Cameron Johnson2020PHO0.5
    Brandon Ingram2020NOP0.5
    Allonzo Trier2020NYK0.5
    Glenn Robinson III2020TOT0.5
    Ben Simmons2020PHI0.5
    Jaren Jackson Jr.2020MEM0.5
    Willie Cauley-Stein2016SAC0.4
    Gary Harris2016DEN0.4
    Matt Bonner2016SAS0.4
    Tyler Johnson2016MIA0.4
    Mike Conley2016MEM0.4
    Channing Frye2016TOT0.4
    Amir Johnson2016BOS0.4
    T.J. Warren2016PHO0.4
    Terrence Ross2016TOR0.4
    David West2016SAS0.4
    Gary Neal2016WAS0.4
    Steve Novak2016TOT0.4
    Ryan Anderson2016NOP0.4
    Ramon Sessions2016WAS0.4
    Miles Plumlee2016MIL0.4
    Patrick Beverley2016HOU0.4
    George Hill2016IND0.4
    Derrick Favors2016UTA0.4
    Richard Jefferson2016CLE0.4
    Marco Belinelli2017CHO0.4
    Marreese Speights2017LAC0.4
    DeMar DeRozan2017TOR0.4
    Kenneth Faried2017DEN0.4
    Boban Marjanović2017DET0.4
    Lucas Nogueira2017TOR0.4
    Dewayne Dedmon2017SAS0.4
    Courtney Lee2017NYK0.4
    Jeff Teague2017IND0.4
    James Jones2017CLE0.4
    Joe Ingles2017UTA0.4
    Kelly Olynyk2017BOS0.4
    Mike Muscala2017ATL0.4
    Derrick Jones Jr.2017PHO0.4
    Tony Snell2018MIL0.4
    Kelly Olynyk2018MIA0.4
    Jeff Green2018CLE0.4
    Meyers Leonard2018POR0.4
    Jordan Bell2018GSW0.4
    Brandan Wright2018TOT0.4
    Mike Scott2018WAS0.4
    Dewayne Dedmon2018ATL0.4
    Mike Muscala2018ATL0.4
    Channing Frye2018TOT0.4
    Anthony Brown2018MIN0.4
    Jonas Jerebko2018UTA0.4
    James Ennis2018TOT0.4
    Kyle O’Quinn2018NYK0.4
    Julius Randle2018LAL0.4
    David West2018GSW0.4
    Derrick White2018SAS0.4
    Norman Powell2019TOR0.4
    Kemba Walker2019CHO0.4
    Kelly Olynyk2019MIA0.4
    Cheick Diallo2019NOP0.4
    Eric Bledsoe2019MIL0.4
    Daniel Theis2019BOS0.4
    Jake Layman2019POR0.4
    Christian Wood2019TOT0.4
    Kyle Korver2019TOT0.4
    Omri Casspi2019MEM0.4
    Otto Porter2019TOT0.4
    Tyler Zeller2019TOT0.4
    Luol Deng2019MIN0.4
    Kentavious Caldwell-Pope2019LAL0.4
    Tony Snell2019MIL0.4
    Demetrius Jackson2019PHI0.4
    LaMarcus Aldridge2019SAS0.4
    Tomáš Satoranský2019WAS0.4
    Malcolm Miller2019TOR0.4
    Nicolas Batum2019CHO0.4
    Ryan Broekhoff2019DAL0.4
    Jordan Sibert2019ATL0.4
    Meyers Leonard2020MIA0.4
    Kelly Olynyk2020MIA0.4
    Drew Eubanks2020SAS0.4
    Justin Holiday2020IND0.4
    Courtney Lee2020DAL0.4
    Jaylen Brown2020BOS0.4
    Harrison Barnes2020SAC0.4
    Timothé Luwawu-Cabarrot2020BRK0.4
    Dennis Schröder2020OKC0.4
    Donta Hall2020TOT0.4
    Landry Shamet2020LAC0.4
    Dean Wade2020CLE0.4
    Ersan İlyasova2020MIL0.4
    Boban Marjanović2020DAL0.4
    Tacko Fall2020BOS0.4
    Dario Šarić2020PHO0.4
    Dusty Hannahs2020MEM0.4
    Montrezl Harrell2016HOU0.3
    Mike Scott2016ATL0.3
    Tim Hardaway Jr.2016ATL0.3
    Luol Deng2016MIA0.3
    C.J. Miles2016IND0.3
    Devin Harris2016DAL0.3
    Shaun Livingston2016GSW0.3
    Chris Andersen2016TOT0.3
    D.J. Augustin2016TOT0.3
    Josh Richardson2016MIA0.3
    Tyson Chandler2016PHO0.3
    Gorgui Dieng2016MIN0.3
    Nikola Mirotić2016CHI0.3
    James Jones2016CLE0.3
    Avery Bradley2016BOS0.3
    Giannis Antetokounmpo2016MIL0.3
    Justin Harper2016DET0.3
    Thanasis Antetokounmpo2016NYK0.3
    Marcin Gortat2017WAS0.3
    Serge Ibaka2017TOT0.3
    Russell Westbrook2017OKC0.3
    Dāvis Bertāns2017SAS0.3
    Demetrius Jackson2017BOS0.3
    Jodie Meeks2017ORL0.3
    Jason Terry2017MIL0.3
    Tristan Thompson2017CLE0.3
    Shawn Long2017PHI0.3
    Marcus Georges-Hunt2017ORL0.3
    Jeremy Lamb2017CHO0.3
    Ian Clark2017GSW0.3
    Shabazz Muhammad2017MIN0.3
    Kentavious Caldwell-Pope2018LAL0.3
    Rodney McGruder2018MIA0.3
    Al Horford2018BOS0.3
    Maurice Harkless2018POR0.3
    George Hill2018TOT0.3
    Allen Crabbe2018BRK0.3
    Richaun Holmes2018PHI0.3
    Kyle Anderson2018SAS0.3
    Nenê2018HOU0.3
    Maxi Kleber2018DAL0.3
    Cody Zeller2018CHO0.3
    Jameel Warney2018DAL0.3
    Doug McDermott2018TOT0.3
    Lucas Nogueira2018TOR0.3
    Amile Jefferson2019ORL0.3
    Patty Mills2019SAS0.3
    Georges Niang2019UTA0.3
    Alan Williams2019BRK0.3
    Robert Covington2019TOT0.3
    Robert Williams2019BOS0.3
    Steven Adams2019OKC0.3
    James Ennis2019TOT0.3
    Andre Iguodala2019GSW0.3
    Isaiah Hicks2019NYK0.3
    Jonas Jerebko2019GSW0.3
    Zach LaVine2019CHI0.3
    Darren Collison2019IND0.3
    Gary Payton II2019WAS0.3
    Dwayne Bacon2019CHO0.3
    Taurean Prince2019ATL0.3
    Chris Paul2019HOU0.3
    Ryan Arcidiacono2019CHI0.3
    Ekpe Udoh2019UTA0.3
    Furkan Korkmaz2020PHI0.3
    Alec Burks2020TOT0.3
    Chris Boucher2020TOR0.3
    Jordan Clarkson2020TOT0.3
    Danuel House2020HOU0.3
    Sviatoslav Mykhailiuk2020DET0.3
    Steven Adams2020OKC0.3
    Jordan McLaughlin2020MIN0.3
    Georges Niang2020UTA0.3
    Caleb Martin2020CHO0.3
    Johnathan Motley2020LAC0.3
    Mfiondu Kabengele2020LAC0.3
    Mason Plumlee2020DEN0.3
    Joe Ingles2020UTA0.3
    Jakob Poeltl2020SAS0.3
    Cristiano Felício2020CHI0.3
    Trevor Ariza2020TOT0.3
    JaKarr Sampson2020IND0.3
    Shamorie Ponds2020TOR0.3
    Jalen McDaniels2020CHO0.3
    Bam Adebayo2020MIA0.3
    Shai Gilgeous-Alexander2020OKC0.3
    CJ McCollum2016POR0.2
    Cole Aldrich2016LAC0.2
    Shabazz Muhammad2016MIN0.2
    Andre Miller2016TOT0.2
    Andre Iguodala2016GSW0.2
    Dewayne Dedmon2016ORL0.2
    Blake Griffin2016LAC0.2
    Courtney Lee2016TOT0.2
    Derrick Williams2016NYK0.2
    Jon Leuer2016PHO0.2
    Thabo Sefolosha2016ATL0.2
    Jorge Gutiérrez2016CHO0.2
    Jeremy Evans2016DAL0.2
    Mario Chalmers2016TOT0.2
    Willie Reed2016BRK0.2
    Salah Mejri2016DAL0.2
    Reggie Bullock2016DET0.2
    Boris Diaw2016SAS0.2
    Mike Dunleavy2016CHI0.2
    Andrew Nicholson2016ORL0.2
    Jonathon Simmons2016SAS0.2
    Anthony Morrow2016OKC0.2
    E’Twaun Moore2016CHI0.2
    Andre Roberson2016OKC0.2
    Joffrey Lauvergne2016DEN0.2
    Paul Millsap2016ATL0.2
    Coty Clarke2016BOS0.2
    Axel Toupane2017TOT0.2
    Avery Bradley2017BOS0.2
    Spencer Dinwiddie2017BRK0.2
    Luc Mbah a Moute2017LAC0.2
    Chasson Randle2017TOT0.2
    Terrence Ross2017TOT0.2
    Michael Beasley2017MIL0.2
    Darrell Arthur2017DEN0.2
    Chinanu Onuaku2017HOU0.2
    Pat Connaughton2017POR0.2
    Quinn Cook2017TOT0.2
    Cristiano Felício2017CHI0.2
    Marvin Williams2017CHO0.2
    Jeremy Lin2017BRK0.2
    Eric Gordon2017HOU0.2
    Eric Bledsoe2017PHO0.2
    Mike Dunleavy2017TOT0.2
    Jared Dudley2017PHO0.2
    Jon Leuer2017DET0.2
    Thaddeus Young2017IND0.2
    DeMar DeRozan2018TOR0.2
    Jeremy Lamb2018CHO0.2
    Okaro White2018MIA0.2
    OG Anunoby2018TOR0.2
    Cheick Diallo2018NOP0.2
    Luke Babbitt2018TOT0.2
    Tyler Zeller2018TOT0.2
    Jeremy Evans2018ATL0.2
    Serge Ibaka2018TOR0.2
    Chandler Parsons2018MEM0.2
    Devin Harris2018TOT0.2
    Robert Covington2018PHI0.2
    Nick Young2018GSW0.2
    Danilo Gallinari2018LAC0.2
    Daniel Theis2018BOS0.2
    Delon Wright2018TOR0.2
    Ivan Rabb2018MEM0.2
    Malcolm Miller2018TOR0.2
    JaKarr Sampson2018SAC0.2
    Álex Abrines2018OKC0.2
    Patty Mills2018SAS0.2
    Ed Davis2019BRK0.2
    CJ McCollum2019POR0.2
    Bam Adebayo2019MIA0.2
    Lou Williams2019LAC0.2
    E’Twaun Moore2019NOP0.2
    Jeremy Lamb2019CHO0.2
    Joe Ingles2019UTA0.2
    Maxi Kleber2019DAL0.2
    Vince Carter2019ATL0.2
    Nemanja Bjelica2019SAC0.2
    JaMychal Green2019TOT0.2
    Brad Wanamaker2019BOS0.2
    Frank Kaminsky2019CHO0.2
    Troy Caupain2019ORL0.2
    Reggie Bullock2019TOT0.2
    Derrick Rose2019MIN0.2
    Pat Connaughton2019MIL0.2
    Marcus Morris2019BOS0.2
    Damion Lee2019GSW0.2
    Enes Kanter2019TOT0.2
    Jahlil Okafor2019NOP0.2
    Trevon Duval2019MIL0.2
    Marquese Chriss2020GSW0.2
    Jahlil Okafor2020NOP0.2
    Goran Dragić2020MIA0.2
    Marvin Williams2020TOT0.2
    Moritz Wagner2020WAS0.2
    Marcus Morris2020TOT0.2
    Joel Embiid2020PHI0.2
    DaQuan Jeffries2020SAC0.2
    Otto Porter2020CHI0.2
    Jeff Green2020TOT0.2
    LaMarcus Aldridge2020SAS0.2
    Kelly Oubre Jr.2020PHO0.2
    Bryn Forbes2020SAS0.2
    Kostas Antetokounmpo2020LAL0.2
    Jamal Crawford2020BRK0.2
    Willie Cauley-Stein2020TOT0.2
    Enes Kanter2020BOS0.2
    Paul Millsap2020DEN0.2
    Tyler Cook2020TOT0.2
    Terence Davis2020TOR0.2
    Patrick Patterson2020LAC0.2
    Max Strus2020CHI0.2
    Amar’e Stoudemire2016MIA0.1
    Nemanja Bjelica2016MIN0.1
    Patty Mills2016SAS0.1
    Jason Terry2016HOU0.1
    Rasual Butler2016SAS0.1
    Brian Roberts2016TOT0.1
    Rodney Hood2016UTA0.1
    Joe Ingles2016UTA0.1
    Bradley Beal2016WAS0.1
    Lance Thomas2016NYK0.1
    Anthony Tolliver2016DET0.1
    Cristiano Felício2016CHI0.1
    Nenê2016WAS0.1
    Meyers Leonard2016POR0.1
    Richaun Holmes2016PHI0.1
    Mike Muscala2016ATL0.1
    John Henson2016MIL0.1
    Jeff Withey2016UTA0.1
    Timofey Mozgov2016CLE0.1
    Kelly Olynyk2016BOS0.1
    Tiago Splitter2016ATL0.1
    Nicolas Batum2016CHO0.1
    Ryan Hollins2016TOT0.1
    Brandon Rush2016GSW0.1
    Joel Anthony2016DET0.1
    Dwight Powell2016DAL0.1
    Trevor Ariza2017HOU0.1
    Jason Smith2017WAS0.1
    Hassan Whiteside2017MIA0.1
    Jarnell Stokes2017DEN0.1
    Larry Nance Jr.2017LAL0.1
    Juan Hernangómez2017DEN0.1
    Arron Afflalo2017SAC0.1
    Doug McDermott2017TOT0.1
    Willie Reed2017MIA0.1
    Treveon Graham2017CHO0.1
    Álex Abrines2017OKC0.1
    Skal Labissière2017SAC0.1
    Greg Monroe2017MIL0.1
    Justin Holiday2017NYK0.1
    James Ennis2017MEM0.1
    Rudy Gay2017SAC0.1
    Greg Monroe2018TOT0.1
    Bogdan Bogdanović2018SAC0.1
    Zaza Pachulia2018GSW0.1
    John Henson2018MIL0.1
    Tyler Johnson2018MIA0.1
    Al Jefferson2018IND0.1
    Salah Mejri2018DAL0.1
    Willy Hernangómez2018TOT0.1
    Alfonzo McKinnie2018TOR0.1
    Lauri Markkanen2018CHI0.1
    Nemanja Bjelica2018MIN0.1
    Luc Mbah a Moute2018HOU0.1
    Tyler Cavanaugh2018ATL0.1
    Jahlil Okafor2018TOT0.1
    Devin Booker2018PHO0.1
    Jack Cooley2018SAC0.1
    Reggie Hearn2018DET0.1
    Edmond Sumner2018IND0.1
    Naz Mitrou-Long2018UTA0.1
    Tyus Jones2018MIN0.1
    Will Barton2018DEN0.1
    Jabari Bird2018BOS0.1
    Kevon Looney2018GSW0.1
    Nerlens Noel2019OKC0.1
    Quinn Cook2019GSW0.1
    Kyle Lowry2019TOR0.1
    Jordan Loyd2019TOR0.1
    Thaddeus Young2019IND0.1
    Justin Jackson2019TOT0.1
    Gordon Hayward2019BOS0.1
    Dante Cunningham2019SAS0.1
    Tahjere McCall2019BRK0.1
    Quincy Pondexter2019SAS0.1
    Luke Kennard2019DET0.1
    Marco Belinelli2019SAS0.1
    Cameron Reynolds2019MIN0.1
    Willie Cauley-Stein2019SAC0.1
    Thomas Welsh2019DEN0.1
    Alex Caruso2019LAL0.1
    Al-Farouq Aminu2019POR0.1
    Mitch Creek2019TOT0.1
    Myles Turner2019IND0.1
    Jonah Bolden2019PHI0.1
    Mason Plumlee2019DEN0.1
    T.J. Leaf2019IND0.1
    Kadeem Allen2019NYK0.1
    Jaren Jackson Jr.2019MEM0.1
    Anthony Tolliver2019MIN0.1
    Serge Ibaka2019TOR0.1
    Larry Nance Jr.2019CLE0.1
    Juan Hernangómez2019DEN0.1
    B.J. Johnson2019TOT0.1
    Jrue Holiday2019NOP0.1
    Marcus Smart2019BOS0.1
    D’Angelo Russell2020TOT0.1
    Derrick Walton2020TOT0.1
    Isaac Bonga2020WAS0.1
    Bogdan Bogdanović2020SAC0.1
    Ryan Broekhoff2020DAL0.1
    Abdel Nader2020OKC0.1
    Taj Gibson2020NYK0.1
    Mike Scott2020PHI0.1
    Juwan Morgan2020UTA0.1
    Alex Len2020TOT0.1
    Jayson Tatum2020BOS0.1
    Trey Lyles2020SAS0.1
    Noah Vonleh2020TOT0.1
    Aron Baynes2020PHO0.1
    Rayjon Tucker2020UTA0.1
    Gary Clark2020TOT0.1
    KZ Okpala2020MIA0.1
    David Lee2016TOT0
    Kevon Looney2016GSW0
    JaVale McGee2016DAL0
    Festus Ezeli2016GSW0
    Toney Douglas2016NOP0
    Lucas Nogueira2016TOR0
    Jarnell Stokes2016TOT0
    Wesley Matthews2016DAL0
    Dante Cunningham2016NOP0
    Tony Parker2016SAS0
    Kyrie Irving2016CLE0
    J.J. Barea2016DAL0
    Robin Lopez2016NYK0
    Jeff Teague2016ATL0
    Clint Capela2016HOU0
    Leandro Barbosa2016GSW0
    Sergey Karasev2016BRK0
    Jeremy Lamb2016CHO0
    Jason Thompson2016TOT0
    Damjan Rudež2016MIN0
    Solomon Hill2016IND0
    Sam Dekker2016HOU0
    Jamal Crawford2016LAC0
    Zach LaVine2016MIN0
    Jabari Parker2016MIL0
    Alonzo Gee2016NOP0
    Glenn Robinson III2017IND0
    Richard Jefferson2017CLE0
    Roy Hibbert2017TOT0
    Luke Babbitt2017MIA0
    John Jenkins2017PHO0
    Caris LeVert2017BRK0
    Thon Maker2017MIL0
    Jeff Withey2017UTA0
    Jerian Grant2017CHI0
    Salah Mejri2017DAL0
    Nick Collison2017OKC0
    Ty Lawson2017SAC0
    Maurice Harkless2017POR0
    T.J. Warren2017PHO0
    Danuel House2017WAS0
    Shaun Livingston2017GSW0
    Joel Bolomboy2017UTA0
    Alex Poythress2017PHI0
    Joel Anthony2017SAS0
    Vince Carter2017MEM0
    Harrison Barnes2017DAL0
    Sam Dekker2017HOU0
    Jodie Meeks2018WAS0
    Boban Marjanović2018TOT0
    Ersan İlyasova2018TOT0
    James Johnson2018MIA0
    Fred VanVleet2018TOR0
    Manu Ginóbili2018SAS0
    Cristiano Felício2018CHI0
    Dakari Johnson2018OKC0
    C.J. Miles2018TOR0
    Daniel Hamilton2018OKC0
    Trey McKinney-Jones2018IND0
    Yogi Ferrell2018DAL0
    Tyler Lydon2018DEN0
    Hassan Whiteside2018MIA0
    T.J. Leaf2018IND0
    Jordan Crawford2018NOP0
    Brook Lopez2018LAL0
    Nick Collison2018OKC0
    Luke Kennard2018DET0
    Mangok Mathiang2018CHO0
    Miloš Teodosić2018LAC0
    Omari Johnson2018MEM0
    Justin Patton2018MIN0
    Gian Clavell2018DAL0
    Chris Boucher2018GSW0
    Marshall Plumlee2018MIL0
    Rodney Hood2018TOT0
    Julyan Stone2018CHO0
    Jacob Pullen2018PHI0
    Justin Anderson2018PHI0
    Gordon Hayward2018BOS0
    Draymond Green2018GSW0
    Ed Davis2018POR0
    Ben Moore2018IND0
    Danuel House2018PHO0
    David Nwaba2019CLE0
    Mike Muscala2019TOT0
    Paul Millsap2019DEN0
    Gerald Green2019HOU0
    Sterling Brown2019MIL0
    Thabo Sefolosha2019UTA0
    Kevin Love2019CLE0
    Ivica Zubac2019TOT0
    Mikal Bridges2019PHO0
    Zhou Qi2019HOU0
    Bismack Biyombo2019CHO0
    Johnathan Williams2019LAL0
    Darius Miller2019NOP0
    Jon Leuer2019DET0
    Ivan Rabb2019MEM0
    Terrance Ferguson2019OKC0
    Patrick Beverley2019LAC0
    Troy Daniels2019PHO0
    Alfonzo McKinnie2019GSW0
    Willy Hernangómez2019CHO0
    John Holland2019CLE0
    Tyler Ulis2019CHI0
    Kobi Simmons2019CLE0
    Royce O’Neale2019UTA0
    Kalin Lucas2019DET0
    Robin Lopez2019CHI0
    Ben Simmons2019PHI0
    John Jenkins2019TOT0
    Alex Len2019ATL0
    George King2019PHO0
    Tyler Davis2019OKC0
    Drew Eubanks2019SAS0
    Langston Galloway2019DET0
    Alen Smailagić2020GSW0
    Jeremy Pargo2020GSW0
    Tobias Harris2020PHI0
    Jusuf Nurkić2020POR0
    Jamal Murray2020DEN0
    Ante Žižić2020CLE0
    Shaquille Harrison2020CHI0
    Domantas Sabonis2020IND0
    J.P. Macura2020CLE0
    John Henson2020TOT0
    Marques Bolden2020CLE0
    Mike Muscala2020OKC0
    Terrence Ross2020ORL0
    Jae Crowder2020TOT0
    Semi Ojeleye2020BOS0
    Monte Morris2020DEN0
    Adam Mokoka2020CHI0
    Tyson Chandler2020HOU0
    Chris Silva2020MIA0
    Thon Maker2020DET0
    Eric Paschall2020GSW0
    Cody Zeller2020CHO0
    Josh Hart2020NOP0
    Brad Wanamaker2020BOS0
    Bojan Bogdanović2016BRK-0.1
    Kent Bazemore2016ATL-0.1
    Delon Wright2016TOR-0.1
    Andrew Wiggins2016MIN-0.1
    Aaron Gordon2016ORL-0.1
    Devin Booker2016PHO-0.1
    Bismack Biyombo2016TOR-0.1
    Rudy Gay2016SAC-0.1
    Larry Nance Jr.2016LAL-0.1
    Jimmer Fredette2016TOT-0.1
    Reggie Jackson2016DET-0.1
    Taj Gibson2016CHI-0.1
    Jordan McRae2016TOT-0.1
    Mason Plumlee2016POR-0.1
    Rudy Gobert2016UTA-0.1
    Kosta Koufos2016SAC-0.1
    James Michael McAdoo2016GSW-0.1
    Isaiah Canaan2016PHI-0.1
    Aron Baynes2016DET-0.1
    Malcolm Brogdon2017MIL-0.1
    Al Horford2017BOS-0.1
    Evan Fournier2017ORL-0.1
    Quincy Acy2017TOT-0.1
    Spencer Hawes2017TOT-0.1
    Joe Harris2017BRK-0.1
    James Johnson2017MIA-0.1
    Norman Powell2017TOR-0.1
    Jarell Eddie2017PHO-0.1
    E’Twaun Moore2017NOP-0.1
    James Young2017BOS-0.1
    Patrick Patterson2017TOR-0.1
    Willie Cauley-Stein2017SAC-0.1
    Nikola Mirotić2017CHI-0.1
    Devin Harris2017DAL-0.1
    Zaza Pachulia2017GSW-0.1
    Steven Adams2017OKC-0.1
    Marc Gasol2017MEM-0.1
    Patrick McCaw2017GSW-0.1
    Reggie Williams2017NOP-0.1
    Reggie Bullock2017DET-0.1
    Justin Hamilton2017BRK-0.1
    Joe Johnson2017UTA-0.1
    Khem Birch2018ORL-0.1
    J.J. Barea2018DAL-0.1
    Kendrick Perkins2018CLE-0.1
    Vince Hunter2018MEM-0.1
    Wesley Matthews2018DAL-0.1
    Frank Kaminsky2018CHO-0.1
    Buddy Hield2018SAC-0.1
    Rashad Vaughn2018TOT-0.1
    Dante Exum2018UTA-0.1
    Jeff Teague2018MIN-0.1
    Tim Quarterman2018HOU-0.1
    Terrance Ferguson2018OKC-0.1
    Raul Neto2018UTA-0.1
    Jared Dudley2018PHO-0.1
    Cedi Osman2018CLE-0.1
    Derrick Walton2018MIA-0.1
    D.J. Wilson2018MIL-0.1
    Kosta Koufos2018SAC-0.1
    Patrick Patterson2018OKC-0.1
    Myles Turner2018IND-0.1
    Ike Anigbogu2018IND-0.1
    PJ Dozier2018OKC-0.1
    Jaylen Brown2018BOS-0.1
    Shaquille Harrison2018PHO-0.1
    Amir Johnson2018PHI-0.1
    James Michael McAdoo2018PHI-0.1
    Alec Peters2018PHO-0.1
    T.J. Warren2018PHO-0.1
    Guerschon Yabusele2018BOS-0.1
    Dante Cunningham2018TOT-0.1
    Pascal Siakam2018TOR-0.1
    Mason Plumlee2018DEN-0.1
    James Young2018PHI-0.1
    Treveon Graham2018CHO-0.1
    Pat Connaughton2018POR-0.1
    Chris Boucher2019TOR-0.1
    Jared Dudley2019BRK-0.1
    Marvin Williams2019CHO-0.1
    Donte Grantham2019OKC-0.1
    Yogi Ferrell2019SAC-0.1
    D.J. Stephens2019MEM-0.1
    Bruno Caboclo2019MEM-0.1
    Skal Labissière2019TOT-0.1
    Derrick White2019SAS-0.1
    Shaun Livingston2019GSW-0.1
    Khris Middleton2019MIL-0.1
    Derrick Jones Jr.2019MIA-0.1
    Nenê2019HOU-0.1
    Harrison Barnes2019TOT-0.1
    Gorgui Dieng2019MIN-0.1
    George Hill2019TOT-0.1
    Rodney Hood2019TOT-0.1
    Tyler Lydon2019DEN-0.1
    Eric Gordon2019HOU-0.1
    Ante Žižić2019CLE-0.1
    Dario Šarić2019TOT-0.1
    Ben McLemore2019SAC-0.1
    Raul Neto2019UTA-0.1
    Miles Bridges2019CHO-0.1
    Davon Reed2019IND-0.1
    Jared Dudley2020LAL-0.1
    Zach LaVine2020CHI-0.1
    Jevon Carter2020PHO-0.1
    Raul Neto2020PHI-0.1
    Trey Burke2020TOT-0.1
    Torrey Craig2020DEN-0.1
    Kyle Alexander2020MIA-0.1
    Maurice Harkless2020TOT-0.1
    Dante Exum2020TOT-0.1
    Harry Giles2020SAC-0.1
    JaMychal Green2020LAC-0.1
    Pat Connaughton2020MIL-0.1
    Josh Gray2020NOP-0.1
    Royce O’Neale2020UTA-0.1
    Jeremy Lamb2020IND-0.1
    Jeremiah Martin2020BRK-0.1
    Ryan Arcidiacono2020CHI-0.1
    Lauri Markkanen2020CHI-0.1
    Joakim Noah2020LAC-0.1
    Chimezie Metu2020SAS-0.1
    Javonte Green2020BOS-0.1
    Eric Bledsoe2020MIL-0.1
    Melvin Frazier2020ORL-0.1
    Chris Clemons2020HOU-0.1
    Nikola Vučević2020ORL-0.1
    Jabari Parker2020TOT-0.1
    Luke Babbitt2016NOP-0.2
    Pau Gasol2016CHI-0.2
    Branden Dawson2016LAC-0.2
    Greg Smith2016MIN-0.2
    Jeff Ayres2016LAC-0.2
    J.J. O’Brien2016UTA-0.2
    Donald Sloan2016BRK-0.2
    Lance Stephenson2016TOT-0.2
    Maurice Harkless2016POR-0.2
    Norman Powell2016TOR-0.2
    Deron Williams2016DAL-0.2
    Patrick Patterson2016TOR-0.2
    Joe Harris2016CLE-0.2
    Victor Oladipo2016ORL-0.2
    Vince Carter2016MEM-0.2
    Alan Anderson2016WAS-0.2
    Eric Moreland2016SAC-0.2
    Erick Green2016TOT-0.2
    Jordan Farmar2016MEM-0.2
    Nazr Mohammed2016OKC-0.2
    Ian Clark2016GSW-0.2
    Lavoy Allen2016IND-0.2
    Marcus Morris2016DET-0.2
    Cliff Alexander2016POR-0.2
    Jrue Holiday2016NOP-0.2
    Mike Miller2016DEN-0.2
    Kyle Anderson2016SAS-0.2
    Arron Afflalo2016NYK-0.2
    Justin Anderson2016DAL-0.2
    Will Barton2016DEN-0.2
    Joe Johnson2016TOT-0.2
    Hollis Thompson2016PHI-0.2
    C.J. Wilcox2016LAC-0.2
    Austin Rivers2016LAC-0.2
    Jerami Grant2017TOT-0.2
    Mike Miller2017DEN-0.2
    Garrett Temple2017SAC-0.2
    Jarrett Jack2017NOP-0.2
    Tyler Johnson2017MIA-0.2
    Ivica Zubac2017LAL-0.2
    Ersan İlyasova2017TOT-0.2
    Danny Green2017SAS-0.2
    Will Barton2017DEN-0.2
    Patrick Beverley2017HOU-0.2
    K.J. McDaniels2017TOT-0.2
    James Michael McAdoo2017GSW-0.2
    Jakob Poeltl2017TOR-0.2
    Bobby Portis2017CHI-0.2
    Aron Baynes2017DET-0.2
    Johnny O’Bryant2017TOT-0.2
    Kosta Koufos2017SAC-0.2
    R.J. Hunter2017CHI-0.2
    Chris McCullough2017TOT-0.2
    Derrick Williams2017TOT-0.2
    Kevon Looney2017GSW-0.2
    Dirk Nowitzki2017DAL-0.2
    Jonas Jerebko2017BOS-0.2
    Andrew Bogut2018LAL-0.2
    Glenn Robinson III2018IND-0.2
    Markieff Morris2018WAS-0.2
    Rudy Gay2018SAS-0.2
    Ryan Arcidiacono2018CHI-0.2
    Richard Jefferson2018DEN-0.2
    Jabari Parker2018MIL-0.2
    Ekpe Udoh2018UTA-0.2
    Jason Terry2018MIL-0.2
    Alex Poythress2018IND-0.2
    Damyean Dotson2018NYK-0.2
    Tarik Black2018HOU-0.2
    Mindaugas Kuzminskas2018NYK-0.2
    Tristan Thompson2018CLE-0.2
    Marcus Georges-Hunt2018MIN-0.2
    Troy Williams2018TOT-0.2
    J.R. Smith2018CLE-0.2
    Josh McRoberts2018DAL-0.2
    Nik Stauskas2018TOT-0.2
    Corey Brewer2018TOT-0.2
    Harrison Barnes2018DAL-0.2
    Isaiah Canaan2018TOT-0.2
    Bam Adebayo2018MIA-0.2
    Sam Dekker2018LAC-0.2
    Shaun Livingston2018GSW-0.2
    Nerlens Noel2018DAL-0.2
    Joakim Noah2018NYK-0.2
    Luke Kornet2019NYK-0.2
    Henry Ellenson2019TOT-0.2
    Reggie Jackson2019DET-0.2
    Cristiano Felício2019CHI-0.2
    Alex Poythress2019ATL-0.2
    Maurice Harkless2019POR-0.2
    Kyle Anderson2019MEM-0.2
    C.J. Williams2019MIN-0.2
    Jeremy Lin2019TOT-0.2
    Jalen Brunson2019DAL-0.2
    Jordan McRae2019WAS-0.2
    James Nunnally2019TOT-0.2
    P.J. Tucker2019HOU-0.2
    Jalen Jones2019CLE-0.2
    Nik Stauskas2019TOT-0.2
    Wesley Matthews2019TOT-0.2
    Fred VanVleet2019TOR-0.2
    Tyson Chandler2019TOT-0.2
    Torrey Craig2019DEN-0.2
    Shai Gilgeous-Alexander2019LAC-0.2
    Duncan Robinson2019MIA-0.2
    Brandon Sampson2019CHI-0.2
    John Henson2019MIL-0.2
    Zach Lofton2019DET-0.2
    Okaro White2019WAS-0.2
    Marvin Bagley III2019SAC-0.2
    Devontae Cacok2020LAL-0.2
    Justin Robinson2020WAS-0.2
    Johnathan Williams2020WAS-0.2
    Buddy Hield2020SAC-0.2
    Patrick Beverley2020LAC-0.2
    Kristaps Porziņģis2020DAL-0.2
    Josh Jackson2020MEM-0.2
    Keita Bates-Diop2020TOT-0.2
    Wesley Matthews2020MIL-0.2
    Terance Mann2020LAC-0.2
    Luke Kornet2020CHI-0.2
    Danny Green2020LAL-0.2
    Malcolm Miller2020TOR-0.2
    Damion Lee2020GSW-0.2
    Skal Labissière2020POR-0.2
    Malik Newman2020CLE-0.2
    Serge Ibaka2020TOR-0.2
    Miye Oni2020UTA-0.2
    Tyler Zeller2020SAS-0.2
    Wendell Carter Jr.2020CHI-0.2
    D.J. Augustin2020ORL-0.2
    Vlatko Čančar2020DEN-0.2
    Jarrod Uthoff2020TOT-0.2
    Myles Turner2020IND-0.2
    Delon Wright2020DAL-0.2
    James Ennis2020TOT-0.2
    Willy Hernangómez2020CHO-0.2
    Terry Rozier2020CHO-0.2
    Isaiah Roby2020OKC-0.2
    Markieff Morris2020TOT-0.2
    Jarred Vanderbilt2020TOT-0.2
    Jordan Bell2020TOT-0.2
    P.J. Tucker2020HOU-0.2
    Nicolò Melli2020NOP-0.2
    Donovan Mitchell2020UTA-0.2
    Donte DiVincenzo2020MIL-0.2
    Zylan Cheatham2020NOP-0.2
    Kyle Guy2020SAC-0.2
    Bismack Biyombo2020CHO-0.2
    Will Barton2020DEN-0.2
    Omari Spellman2020GSW-0.2
    Robert Covington2020TOT-0.2
    Kyle O’Quinn2020PHI-0.2
    Mychal Mulder2020GSW-0.2
    Brook Lopez2020MIL-0.2
    Paul Watson2020TOT-0.2
    Marco Belinelli2020SAS-0.2
    Wesley Iwundu2020ORL-0.2
    Lou Williams2020LAC-0.2
    Tyus Jones2020MEM-0.2
    Damyean Dotson2020NYK-0.2
    Austin Rivers2020HOU-0.2
    Wesley Johnson2016LAC-0.3
    Edy Tavares2016ATL-0.3
    Matthew Dellavedova2016CLE-0.3
    Glenn Robinson III2016IND-0.3
    Josh Huestis2016OKC-0.3
    Tyler Hansbrough2016CHO-0.3
    Gerald Henderson2016POR-0.3
    Caron Butler2016SAC-0.3
    Sasha Kaun2016CLE-0.3
    Ersan İlyasova2016TOT-0.3
    Garrett Temple2016WAS-0.3
    Mario Hezonja2016ORL-0.3
    Chase Budinger2016TOT-0.3
    John Jenkins2016TOT-0.3
    Ricky Rubio2016MIN-0.3
    Tyler Zeller2016BOS-0.3
    Axel Toupane2016DEN-0.3
    Raul Neto2016UTA-0.3
    Andrew Goudelock2016HOU-0.3
    Jarell Martin2016MEM-0.3
    Luis Scola2016TOR-0.3
    Christian Wood2016PHI-0.3
    Ömer Aşık2016NOP-0.3
    Carmelo Anthony2016NYK-0.3
    K.J. McDaniels2016HOU-0.3
    Mo Williams2016CLE-0.3
    Chris Kaman2016POR-0.3
    Ricky Rubio2017MIN-0.3
    Anthony Bennett2017BRK-0.3
    Beno Udrih2017DET-0.3
    Kevin Séraphin2017IND-0.3
    Ian Mahinmi2017WAS-0.3
    DeMarcus Cousins2017TOT-0.3
    Tiago Splitter2017PHI-0.3
    Troy Daniels2017MEM-0.3
    Iman Shumpert2017CLE-0.3
    Willy Hernangómez2017NYK-0.3
    Sheldon Mac2017WAS-0.3
    Gorgui Dieng2017MIN-0.3
    Malik Beasley2017DEN-0.3
    David West2017GSW-0.3
    Tim Quarterman2017POR-0.3
    Kristaps Porziņģis2017NYK-0.3
    Manu Ginóbili2017SAS-0.3
    DeMarre Carroll2017TOR-0.3
    Tarik Black2017LAL-0.3
    John Lucas III2017MIN-0.3
    Mason Plumlee2017TOT-0.3
    Wilson Chandler2017DEN-0.3
    Raul Neto2017UTA-0.3
    Kyle O’Quinn2017NYK-0.3
    Buddy Hield2017TOT-0.3
    Anthony Morrow2017TOT-0.3
    Malachi Richardson2017SAC-0.3
    Deyonta Davis2017MEM-0.3
    Larry Sanders2017CLE-0.3
    Tyus Jones2017MIN-0.3
    Steve Novak2017MIL-0.3
    Ian Clark2018NOP-0.3
    Johnathan Motley2018DAL-0.3
    Royce O’Neale2018UTA-0.3
    Kenneth Faried2018DEN-0.3
    Jacob Wiley2018BRK-0.3
    Ivica Zubac2018LAL-0.3
    Josh Richardson2018MIA-0.3
    Vince Carter2018SAC-0.3
    Pau Gasol2018SAS-0.3
    DeMarre Carroll2018BRK-0.3
    Trevor Booker2018TOT-0.3
    Emeka Okafor2018NOP-0.3
    Aaron Brooks2018MIN-0.3
    Patrick Beverley2018LAC-0.3
    DeMarcus Cousins2018NOP-0.3
    Torrey Craig2018DEN-0.3
    Blake Griffin2018TOT-0.3
    Nicolás Brussino2018ATL-0.3
    Shabazz Muhammad2018TOT-0.3
    Wayne Selden2018MEM-0.3
    Juan Hernangómez2018DEN-0.3
    Andre Iguodala2018GSW-0.3
    Marreese Speights2018ORL-0.3
    Tim Hardaway Jr.2018NYK-0.3
    Michael Beasley2018NYK-0.3
    Michael Kidd-Gilchrist2018CHO-0.3
    Arron Afflalo2018ORL-0.3
    Kent Bazemore2018ATL-0.3
    Shabazz Napier2018POR-0.3
    Jeff Withey2018DAL-0.3
    Matt Costello2018SAS-0.3
    Joffrey Lauvergne2018SAS-0.3
    Mario Hezonja2018ORL-0.3
    Chasson Randle2019WAS-0.3
    Guerschon Yabusele2019BOS-0.3
    Jarell Martin2019ORL-0.3
    Ersan İlyasova2019MIL-0.3
    Matthew Dellavedova2019TOT-0.3
    Semi Ojeleye2019BOS-0.3
    Hassan Whiteside2019MIA-0.3
    Garrett Temple2019TOT-0.3
    Channing Frye2019CLE-0.3
    Jae Crowder2019UTA-0.3
    Joakim Noah2019MEM-0.3
    Amir Johnson2019PHI-0.3
    Lauri Markkanen2019CHI-0.3
    Kyle O’Quinn2019IND-0.3
    T.J. McConnell2019PHI-0.3
    Aron Baynes2019BOS-0.3
    Michael Kidd-Gilchrist2019CHO-0.3
    Troy Williams2019SAC-0.3
    Miloš Teodosić2019LAC-0.3
    Jusuf Nurkić2019POR-0.3
    Sindarius Thornwell2019LAC-0.3
    Thon Maker2019TOT-0.3
    Johnathan Motley2019LAC-0.3
    Wilson Chandler2019TOT-0.3
    Eric Moreland2019TOT-0.3
    Jerome Robinson2019LAC-0.3
    Allonzo Trier2019NYK-0.3
    Furkan Korkmaz2019PHI-0.3
    Isaiah Hartenstein2019HOU-0.3
    Patrick McCaw2019TOT-0.3
    Gorgui Dieng2020TOT-0.3
    James Johnson2020TOT-0.3
    Derrick Rose2020DET-0.3
    Jared Harper2020PHO-0.3
    Jalen Brunson2020DAL-0.3
    Malik Beasley2020TOT-0.3
    Collin Sexton2020CLE-0.3
    Tyler Herro2020MIA-0.3
    Talen Horton-Tucker2020LAL-0.3
    Nicolas Claxton2020BRK-0.3
    Vincent Poirier2020BOS-0.3
    Solomon Hill2020TOT-0.3
    Khem Birch2020ORL-0.3
    Deandre Ayton2020PHO-0.3
    Avery Bradley2020LAL-0.3
    Marcus Thornton2016TOT-0.4
    Jodie Meeks2016DET-0.4
    Kirk Hinrich2016TOT-0.4
    Kris Humphries2016TOT-0.4
    Goran Dragić2016MIA-0.4
    Tarik Black2016LAL-0.4
    Ronnie Price2016PHO-0.4
    Jarell Eddie2016WAS-0.4
    Darrell Arthur2016DEN-0.4
    R.J. Hunter2016BOS-0.4
    Serge Ibaka2016OKC-0.4
    Jonas Jerebko2016BOS-0.4
    Darrun Hilliard2016DET-0.4
    Anthony Bennett2016TOR-0.4
    Nikola Vučević2016ORL-0.4
    Nik Stauskas2016PHI-0.4
    Cory Jefferson2016PHO-0.4
    Myles Turner2016IND-0.4
    Trey Lyles2016UTA-0.4
    Wayne Ellington2016BRK-0.4
    Luc Mbah a Moute2016LAC-0.4
    Jordan Hill2016IND-0.4
    Jordan Mickey2016BOS-0.4
    J.J. Hickson2016TOT-0.4
    Mitch McGary2016OKC-0.4
    Tim Duncan*2016SAS-0.4
    Kentavious Caldwell-Pope2016DET-0.4
    Tyler Ennis2016MIL-0.4
    Pablo Prigioni2016LAC-0.4
    Bobby Brown2017HOU-0.4
    Cole Aldrich2017MIN-0.4
    Trey Burke2017WAS-0.4
    Arinze Onuaku2017ORL-0.4
    Christian Wood2017CHO-0.4
    Luis Scola2017BRK-0.4
    Maurice Ndour2017NYK-0.4
    Gerald Green2017BOS-0.4
    Al Jefferson2017IND-0.4
    Gerald Henderson2017PHI-0.4
    Jameer Nelson2017DEN-0.4
    Nik Stauskas2017PHI-0.4
    Paul Millsap2017ATL-0.4
    Ben McLemore2017SAC-0.4
    Aaron Gordon2017ORL-0.4
    Georgios Papagiannis2017SAC-0.4
    Ömer Aşık2017NOP-0.4
    Alan Williams2017PHO-0.4
    Tyler Zeller2017BOS-0.4
    Rakeem Christmas2017IND-0.4
    Brian Roberts2017CHO-0.4
    Damjan Rudež2017ORL-0.4
    Chris Andersen2017CLE-0.4
    Paul Pierce2017LAC-0.4
    Michael Kidd-Gilchrist2017CHO-0.4
    Austin Rivers2017LAC-0.4
    Solomon Hill2017NOP-0.4
    John Henson2017MIL-0.4
    Ed Davis2017POR-0.4
    Wesley Matthews2017DAL-0.4
    Deron Williams2017TOT-0.4
    Carmelo Anthony2017NYK-0.4
    Alan Anderson2017LAC-0.4
    D.J. Augustin2017ORL-0.4
    José Calderón2017TOT-0.4
    Langston Galloway2017TOT-0.4
    J.J. Barea2017DAL-0.4
    Markieff Morris2017WAS-0.4
    Mirza Teletović2017MIL-0.4
    Marcus Morris2018BOS-0.4
    Ian Mahinmi2018WAS-0.4
    Chris McCullough2018WAS-0.4
    Ron Baker2018NYK-0.4
    David Nwaba2018CHI-0.4
    Jarell Eddie2018TOT-0.4
    CJ McCollum2018POR-0.4
    Malik Beasley2018DEN-0.4
    Jerian Grant2018CHI-0.4
    Erik McCree2018UTA-0.4
    Damian Jones2018GSW-0.4
    Kyle Kuzma2018LAL-0.4
    Andrew Harrison2018MEM-0.4
    Gorgui Dieng2018MIN-0.4
    Brandon Paul2018SAS-0.4
    Justin Jackson2018SAC-0.4
    Jerryd Bayless2018PHI-0.4
    Luke Kornet2018NYK-0.4
    Joel Bolomboy2018MIL-0.4
    Bryn Forbes2018SAS-0.4
    Ben Simmons2018PHI-0.4
    Goran Dragić2018MIA-0.4
    Garrett Temple2018SAC-0.4
    Briante Weber2018TOT-0.4
    Alex Caruso2018LAL-0.4
    T.J. McConnell2018PHI-0.4
    Jordan Clarkson2018TOT-0.4
    Andre Roberson2018OKC-0.4
    Eric Moreland2018DET-0.4
    Wilson Chandler2018DEN-0.4
    Rondae Hollis-Jefferson2018BRK-0.4
    Cole Aldrich2018MIN-0.4
    Brice Johnson2018TOT-0.4
    Jae Crowder2018TOT-0.4
    Taurean Prince2018ATL-0.4
    Kelly Oubre Jr.2018WAS-0.4
    P.J. Tucker2018HOU-0.4
    Scotty Hopson2018DAL-0.4
    Darrell Arthur2018DEN-0.4
    Domantas Sabonis2018IND-0.4
    Joe Young2018IND-0.4
    Josh Smith2018NOP-0.4
    DeAndre Liggins2018TOT-0.4
    Wesley Iwundu2019ORL-0.4
    Corey Brewer2019TOT-0.4
    Jabari Parker2019TOT-0.4
    Mike Scott2019TOT-0.4
    OG Anunoby2019TOR-0.4
    Kelly Oubre Jr.2019TOT-0.4
    Tyler Cavanaugh2019UTA-0.4
    Terrence Jones2019HOU-0.4
    Zach Collins2019POR-0.4
    DeMarre Carroll2019BRK-0.4
    Pau Gasol2019TOT-0.4
    Salah Mejri2019DAL-0.4
    Raymond Felton2019OKC-0.4
    Jonathan Isaac2019ORL-0.4
    Jerian Grant2019ORL-0.4
    Chris Chiozza2019HOU-0.4
    Shabazz Napier2019BRK-0.4
    Marcin Gortat2019LAC-0.4
    Emanuel Terry2019TOT-0.4
    Kevin Huerter2019ATL-0.4
    Gary Clark2019HOU-0.4
    Nick Young2019DEN-0.4
    Trevor Ariza2019TOT-0.4
    Jarred Vanderbilt2019DEN-0.4
    Anfernee Simons2019POR-0.4
    Ian Mahinmi2019WAS-0.4
    Jordan Bell2019GSW-0.4
    Devin Harris2019DAL-0.4
    Justin Anderson2019ATL-0.4
    Abdel Nader2019OKC-0.4
    Jaron Blossomgame2019CLE-0.4
    Glenn Robinson III2019DET-0.4
    Corey Brewer2020SAC-0.4
    Luc Mbah a Moute2020HOU-0.4
    Charlie Brown2020ATL-0.4
    Troy Daniels2020TOT-0.4
    Daryl Macon2020MIA-0.4
    Al Horford2020PHI-0.4
    Stephen Curry2020GSW-0.4
    Fred VanVleet2020TOR-0.4
    Bruno Fernando2020ATL-0.4
    Yogi Ferrell2020SAC-0.4
    Yuta Watanabe2020MEM-0.4
    Cedi Osman2020CLE-0.4
    Jeff Teague2020TOT-0.4
    Matisse Thybulle2020PHI-0.4
    Admiral Schofield2020WAS-0.4
    Nassir Little2020POR-0.4
    De’Aaron Fox2020SAC-0.4
    Frank Kaminsky2020PHO-0.4
    Khyri Thomas2020DET-0.4
    CJ McCollum2020POR-0.4
    Jake Layman2020MIN-0.4
    Alex Caruso2020LAL-0.4
    Rudy Gay2020SAS-0.4
    Kevin Huerter2020ATL-0.4
    Bol Bol2020DEN-0.4
    Michael Carter-Williams2020ORL-0.4
    Dragan Bender2020TOT-0.4
    Jonathan Isaac2020ORL-0.4
    Thabo Sefolosha2020HOU-0.4
    Jaylen Hoard2020POR-0.4
    Rodions Kurucs2020BRK-0.4
    Elie Okobo2020PHO-0.4
    Chuck Hayes2016HOU-0.5
    Nate Robinson2016NOP-0.5
    Steve Blake2016DET-0.5
    Trevor Booker2016UTA-0.5
    Jason Smith2016ORL-0.5
    Kevin Garnett*2016MIN-0.5
    Chris Copeland2016MIL-0.5
    Kyle O’Quinn2016NYK-0.5
    Kevin Martin2016TOT-0.5
    Al-Farouq Aminu2016POR-0.5
    James Johnson2016TOR-0.5
    Kelly Oubre Jr.2016WAS-0.5
    Thaddeus Young2016BRK-0.5
    Markel Brown2016BRK-0.5
    Robert Covington2016PHI-0.5
    Udonis Haslem2016MIA-0.5
    Al Jefferson2016CHO-0.5
    Rondae Hollis-Jefferson2016BRK-0.5
    Justin Holiday2016TOT-0.5
    Zach Randolph2016MEM-0.5
    Tayshaun Prince2016MIN-0.5
    Nick Collison2016OKC-0.5
    Bryce Dejean-Jones2016NOP-0.5
    Terrence Jones2016HOU-0.5
    Zaza Pachulia2016DAL-0.5
    Frank Kaminsky2016CHO-0.5
    Sasha Vujačić2016NYK-0.5
    Jeremy Lin2016CHO-0.5
    Justin Anderson2017TOT-0.5
    Tyler Ennis2017TOT-0.5
    Kyle Anderson2017SAS-0.5
    Shabazz Napier2017POR-0.5
    Adreian Payne2017MIN-0.5
    Lance Thomas2017NYK-0.5
    Mindaugas Kuzminskas2017NYK-0.5
    Thabo Sefolosha2017ATL-0.5
    Nicolás Brussino2017DAL-0.5
    Yogi Ferrell2017TOT-0.5
    Jaylen Brown2017BOS-0.5
    C.J. Watson2017ORL-0.5
    Kyle Wiltjer2017HOU-0.5
    Delon Wright2017TOR-0.5
    Nicolás Laprovíttola2017SAS-0.5
    Timothé Luwawu-Cabarrot2017PHI-0.5
    Kris Humphries2017ATL-0.5
    Pascal Siakam2017TOR-0.5
    Alex Len2017PHO-0.5
    LaMarcus Aldridge2017SAS-0.5
    Meyers Leonard2017POR-0.5
    Leandro Barbosa2017PHO-0.5
    Sean Kilpatrick2017BRK-0.5
    Anderson Varejão2017GSW-0.5
    Lavoy Allen2017IND-0.5
    Paul Millsap2018DEN-0.5
    Malcolm Delaney2018ATL-0.5
    Sindarius Thornwell2018LAC-0.5
    Matt Williams2018MIA-0.5
    Langston Galloway2018DET-0.5
    Timofey Mozgov2018BRK-0.5
    Nicolas Batum2018CHO-0.5
    Travis Wear2018LAL-0.5
    Thomas Bryant2018LAL-0.5
    Jonathon Simmons2018ORL-0.5
    Marcin Gortat2018WAS-0.5
    Bismack Biyombo2018ORL-0.5
    Tony Bradley2018UTA-0.5
    Antonius Cleveland2018TOT-0.5
    Sterling Brown2018MIL-0.5
    Wesley Johnson2018LAC-0.5
    Ricky Rubio2018UTA-0.5
    Derrick Jones Jr.2018TOT-0.5
    Bobby Portis2018CHI-0.5
    Georges Niang2018UTA-0.5
    Thaddeus Young2018IND-0.5
    Joel Embiid2018PHI-0.5
    Derrick Williams2018LAL-0.5
    C.J. Williams2018LAC-0.5
    Nikola Vučević2018ORL-0.5
    Denzel Valentine2018CHI-0.5
    Ben McLemore2018MEM-0.5
    Spencer Dinwiddie2018BRK-0.5
    Lorenzo Brown2018TOR-0.5
    Alec Burks2018UTA-0.5
    Trey Burke2019TOT-0.5
    Vince Edwards2019HOU-0.5
    Luka Dončić2019DAL-0.5
    Tim Frazier2019TOT-0.5
    Jayson Tatum2019BOS-0.5
    De’Aaron Fox2019SAC-0.5
    Ike Anigbogu2019IND-0.5
    Cedi Osman2019CLE-0.5
    Zhaire Smith2019PHI-0.5
    Damyean Dotson2019NYK-0.5
    Michael Beasley2019LAL-0.5
    Malachi Richardson2019TOR-0.5
    Patrick Patterson2019OKC-0.5
    Tyler Johnson2019TOT-0.5
    Evan Fournier2019ORL-0.5
    Josh Richardson2019MIA-0.5
    Joe Chealey2019CHO-0.5
    Frank Jackson2019NOP-0.5
    Deonte Burton2019OKC-0.5
    Jordan Clarkson2019CLE-0.5
    Ray Spalding2019TOT-0.5
    Jaylen Brown2019BOS-0.5
    Brandon Goodwin2019DEN-0.5
    D.J. Wilson2019MIL-0.5
    Aaron Holiday2019IND-0.5
    Tristan Thompson2019CLE-0.5
    Dorian Finney-Smith2019DAL-0.5
    Omari Spellman2019ATL-0.5
    Moritz Wagner2019LAL-0.5
    Courtney Lee2019TOT-0.5
    Noah Vonleh2019NYK-0.5
    Hamidou Diallo2019OKC-0.5
    Kyle Kuzma2019LAL-0.5
    Dragan Bender2019PHO-0.5
    Matt Mooney2020CLE-0.5
    Moses Brown2020POR-0.5
    Tariq Owens2020PHO-0.5
    Pascal Siakam2020TOR-0.5
    Justin James2020SAC-0.5
    Shabazz Napier2020TOT-0.5
    Anthony Tolliver2020TOT-0.5
    Caleb Swanigan2020TOT-0.5
    Amir Coffey2020LAC-0.5
    Anžejs Pasečņiks2020WAS-0.5
    Kyle Anderson2020MEM-0.5
    Marc Gasol2020TOR-0.5
    Malik Monk2020CHO-0.5
    Mo Bamba2020ORL-0.5
    Wenyen Gabriel2020TOT-0.5
    Louis King2020DET-0.5
    Denzel Valentine2020CHI-0.5
    Nigel Williams-Goss2020UTA-0.5
    Alize Johnson2020IND-0.5
    P.J. Washington2020CHO-0.5
    Justin Jackson2020DAL-0.5
    Goga Bitadze2020IND-0.5
    Amile Jefferson2020ORL-0.5
    Josh Okogie2020MIN-0.5
    Juan Hernangómez2020TOT-0.5
    Chandler Hutchison2020CHI-0.5
    Mario Hezonja2020POR-0.5
    Bryce Cotton2016TOT-0.6
    Aaron Harrison2016CHO-0.6
    Russ Smith2016MEM-0.6
    James Young2016BOS-0.6
    Anderson Varejão2016TOT-0.6
    Trey Burke2016UTA-0.6
    Damien Inglis2016MIL-0.6
    Kostas Papanikolaou2016DEN-0.6
    Kyle Singler2016OKC-0.6
    Andrea Bargnani2016BRK-0.6
    Marco Belinelli2016SAC-0.6
    Cameron Payne2016OKC-0.6
    Donatas Motiejūnas2016HOU-0.6
    Langston Galloway2016NYK-0.6
    Henry Sims2016BRK-0.6
    Chris Johnson2016UTA-0.6
    Raymond Felton2016DAL-0.6
    Shane Larkin2016BRK-0.6
    JaMychal Green2016MEM-0.6
    Nerlens Noel2016PHI-0.6
    Thomas Robinson2017LAL-0.6
    DeAndre’ Bembry2017ATL-0.6
    Kyle Singler2017OKC-0.6
    Daniel Ochefu2017WAS-0.6
    Nemanja Bjelica2017MIN-0.6
    Cheick Diallo2017NOP-0.6
    Timofey Mozgov2017LAL-0.6
    Kelly Oubre Jr.2017WAS-0.6
    Trevor Booker2017BRK-0.6
    Taurean Prince2017ATL-0.6
    Udonis Haslem2017MIA-0.6
    Taj Gibson2017TOT-0.6
    Jordan Mickey2017BOS-0.6
    Andre Roberson2017OKC-0.6
    Marshall Plumlee2017NYK-0.6
    Kentavious Caldwell-Pope2017DET-0.6
    Bruno Caboclo2017TOR-0.6
    Brandon Rush2017MIN-0.6
    Victor Oladipo2017OKC-0.6
    Joe Young2017IND-0.6
    Matt Barnes2017TOT-0.6
    Draymond Green2017GSW-0.6
    P.J. Tucker2017TOT-0.6
    Jamal Crawford2017LAC-0.6
    Lance Thomas2018NYK-0.6
    Jamal Crawford2018MIN-0.6
    Miles Plumlee2018ATL-0.6
    Timothé Luwawu-Cabarrot2018PHI-0.6
    Tony Allen2018NOP-0.6
    Markel Brown2018HOU-0.6
    Noah Vonleh2018TOT-0.6
    Robin Lopez2018CHI-0.6
    Dillon Brooks2018MEM-0.6
    Thon Maker2018MIL-0.6
    Demetrius Jackson2018TOT-0.6
    Quincy Acy2018BRK-0.6
    Shelvin Mack2018ORL-0.6
    Dwight Howard2018CHO-0.6
    Xavier Silas2018BOS-0.6
    Rajon Rondo2018NOP-0.6
    Dragan Bender2018PHO-0.6
    Ish Smith2018DET-0.6
    Josh Magette2018ATL-0.6
    Jake Layman2018POR-0.6
    Semi Ojeleye2018BOS-0.6
    Mike Conley2018MEM-0.6
    Terry Rozier2018BOS-0.6
    Wesley Iwundu2018ORL-0.6
    Marcus Paige2018CHO-0.6
    Jordan Mickey2018MIA-0.6
    Danny Green2018SAS-0.6
    Josh Hart2019LAL-0.6
    DeMarcus Cousins2019GSW-0.6
    Dion Waiters2019MIA-0.6
    Jaylen Morris2019MIL-0.6
    Sam Dekker2019TOT-0.6
    Jamal Crawford2019PHO-0.6
    Andrew Bogut2019GSW-0.6
    Justin Holiday2019TOT-0.6
    Lance Stephenson2019LAL-0.6
    Alec Burks2019TOT-0.6
    Brandon Ingram2019LAL-0.6
    Rodions Kurucs2019BRK-0.6
    Álex Abrines2019OKC-0.6
    Chandler Hutchison2019CHI-0.6
    Alize Johnson2019IND-0.6
    Bogdan Bogdanović2019SAC-0.6
    Markieff Morris2019TOT-0.6
    Mo Bamba2019ORL-0.6
    Tyler Dorsey2019TOT-0.6
    Solomon Hill2019NOP-0.6
    C.J. Miles2019TOT-0.6
    Cameron Payne2019TOT-0.6
    Jamal Murray2019DEN-0.6
    Donte DiVincenzo2019MIL-0.6
    Marc Gasol2019TOT-0.6
    Delon Wright2019TOT-0.6
    Isaiah Canaan2019TOT-0.6
    Daryl Macon2019DAL-0.6
    Josh Reaves2020DAL-0.6
    Bruno Caboclo2020TOT-0.6
    Rondae Hollis-Jefferson2020TOR-0.6
    Jaylen Nowell2020MIN-0.6
    Ed Davis2020UTA-0.6
    Josh Magette2020ORL-0.6
    Wayne Ellington2020NYK-0.6
    Oshae Brissett2020TOR-0.6
    Thanasis Antetokounmpo2020MIL-0.6
    Justin Patton2020OKC-0.6
    Cory Joseph2020SAC-0.6
    Mike Conley2020UTA-0.6
    Zach Norvell2020TOT-0.6
    Brandon Goodwin2020ATL-0.6
    Rodney McGruder2020LAC-0.6
    Udonis Haslem2020MIA-0.6
    Spencer Dinwiddie2020BRK-0.6
    Ja Morant2020MEM-0.6
    Tomáš Satoranský2020CHI-0.6
    Robin Lopez2020MIL-0.6
    DeMarre Carroll2020TOT-0.6
    Marko Guduric2020MEM-0.6
    Ricky Rubio2020PHO-0.6
    J.J. Barea2020DAL-0.6
    Lamar Patterson2016ATL-0.7
    Marcelo Huertas2016LAL-0.7
    Evan Turner2016BOS-0.7
    Spencer Hawes2016CHO-0.7
    Sonny Weems2016TOT-0.7
    Matt Barnes2016MEM-0.7
    Jared Cunningham2016TOT-0.7
    Beno Udrih2016TOT-0.7
    Roy Hibbert2016LAL-0.7
    Brandon Knight2016PHO-0.7
    Jeff Green2016TOT-0.7
    Aaron Brooks2016CHI-0.7
    Paul Pierce2016LAC-0.7
    DeMarcus Cousins2016SAC-0.7
    Luis Montero2016POR-0.7
    Alec Burks2016UTA-0.7
    Ray McCallum2016TOT-0.7
    Pat Connaughton2016POR-0.7
    Alexis Ajinça2016NOP-0.7
    Alan Williams2016PHO-0.7
    Brandon Jennings2016TOT-0.7
    Robert Sacre2016LAL-0.7
    Shelvin Mack2016TOT-0.7
    Rodney Stuckey2016IND-0.7
    P.J. Tucker2016PHO-0.7
    Ben McLemore2016SAC-0.7
    Cory Joseph2016TOR-0.7
    Danny Green2016SAS-0.7
    Aaron Brooks2017IND-0.7
    Nicolas Batum2017CHO-0.7
    Alexis Ajinça2017NOP-0.7
    Bryn Forbes2017SAS-0.7
    Randy Foye2017BRK-0.7
    Jarrod Uthoff2017DAL-0.7
    Dante Exum2017UTA-0.7
    Wayne Selden2017TOT-0.7
    Jordan McRae2017CLE-0.7
    John Wall2017WAS-0.7
    Okaro White2017MIA-0.7
    Aaron Harrison2017CHO-0.7
    Dahntay Jones2017CLE-0.7
    Cory Joseph2017TOR-0.7
    Briante Weber2017TOT-0.7
    Rodney Hood2017UTA-0.7
    Joffrey Lauvergne2017TOT-0.7
    Omri Casspi2017TOT-0.7
    Miles Plumlee2017TOT-0.7
    Wesley Johnson2017LAC-0.7
    Ryan Kelly2017ATL-0.7
    Joel Embiid2017PHI-0.7
    Troy Williams2017TOT-0.7
    Rodney McGruder2017MIA-0.7
    Noah Vonleh2017POR-0.7
    Hollis Thompson2017TOT-0.7
    Derrick Rose2017NYK-0.7
    Tomáš Satoranský2017WAS-0.7
    Brice Johnson2017LAC-0.7
    Terrence Jones2017TOT-0.7
    Denzel Valentine2017CHI-0.7
    Bismack Biyombo2017ORL-0.7
    Jamal Murray2017DEN-0.7
    Tony Parker2017SAS-0.7
    Matthew Dellavedova2018MIL-0.7
    Andre Drummond2018DET-0.7
    JaMychal Green2018MEM-0.7
    Luis Montero2018DET-0.7
    Nate Wolters2018UTA-0.7
    Henry Ellenson2018DET-0.7
    Sean Kilpatrick2018TOT-0.7
    Luol Deng2018LAL-0.7
    Shane Larkin2018BOS-0.7
    Damien Wilkins2018IND-0.7
    Terrence Ross2018ORL-0.7
    Evan Turner2018POR-0.7
    Donovan Mitchell2018UTA-0.7
    Kyle Singler2018OKC-0.7
    Devin Robinson2018WAS-0.7
    Al-Farouq Aminu2018POR-0.7
    Xavier Munford2018MIL-0.7
    José Calderón2019DET-0.7
    Frank Mason III2019SAC-0.7
    Greg Monroe2019TOT-0.7
    Haywood Highsmith2019PHI-0.7
    PJ Dozier2019BOS-0.7
    Jaylen Adams2019ATL-0.7
    Zaza Pachulia2019DET-0.7
    Tyus Jones2019MIN-0.7
    Yante Maten2019MIA-0.7
    Wesley Johnson2019TOT-0.7
    Shake Milton2019PHI-0.7
    Malik Monk2019CHO-0.7
    Draymond Green2019GSW-0.7
    Gary Harris2019DEN-0.7
    Timothé Luwawu-Cabarrot2019TOT-0.7
    Lonnie Walker2019SAS-0.7
    Deng Adel2019CLE-0.7
    Theo Pinson2019BRK-0.7
    Grayson Allen2019UTA-0.7
    DeMar DeRozan2019SAS-0.7
    Jalen Lecque2020PHO-0.7
    Chasson Randle2020GSW-0.7
    Jonah Bolden2020TOT-0.7
    Henry Ellenson2020BRK-0.7
    Antonius Cleveland2020DAL-0.7
    Ryan Anderson2020HOU-0.7
    Quinn Cook2020LAL-0.7
    Grant Williams2020BOS-0.7
    Brian Bowen2020IND-0.7
    Emmanuel Mudiay2020UTA-0.7
    Aaron Holiday2020IND-0.7
    Chris Chiozza2020TOT-0.7
    Juan Toscano-Anderson2020GSW-0.7
    Rui Hachimura2020WAS-0.7
    T.J. McConnell2020IND-0.7
    Reggie Jackson2020TOT-0.7
    Luguentz Dort2020OKC-0.7
    Wilson Chandler2020BRK-0.7
    Troy Brown Jr.2020WAS-0.7
    Kendrick Nunn2020MIA-0.7
    E’Twaun Moore2020NOP-0.7
    Tyler Johnson2020TOT-0.7
    Ian Mahinmi2020WAS-0.7
    Norvel Pelle2020PHI-0.7
    Isaiah Thomas2020WAS-0.7
    Keith Appling2016ORL-0.8
    T.J. McConnell2016PHI-0.8
    Jordan Clarkson2016LAL-0.8
    Kristaps Porziņģis2016NYK-0.8
    Shabazz Napier2016ORL-0.8
    Nick Young2016LAL-0.8
    Marreese Speights2016GSW-0.8
    Jerian Grant2016NYK-0.8
    Tyus Jones2016MIN-0.8
    Tyreke Evans2016NOP-0.8
    Charlie Villanueva2016DAL-0.8
    Elliot Williams2016MEM-0.8
    Gerald Green2016MIA-0.8
    Tony Allen2016MEM-0.8
    Ty Lawson2016TOT-0.8
    Cameron Bairstow2016CHI-0.8
    Dwyane Wade2016MIA-0.8
    Kendrick Perkins2016NOP-0.8
    Marc Gasol2016MEM-0.8
    Archie Goodwin2016PHO-0.8
    C.J. Watson2016ORL-0.8
    Jahlil Okafor2016PHI-0.8
    Matthew Dellavedova2017MIL-0.8
    DeAndre Liggins2017TOT-0.8
    Jordan Farmar2017SAC-0.8
    Isaiah Canaan2017CHI-0.8
    Dejounte Murray2017SAS-0.8
    Andrew Wiggins2017MIN-0.8
    Marquese Chriss2017PHO-0.8
    Dorian Finney-Smith2017DAL-0.8
    C.J. Wilcox2017ORL-0.8
    Ben Bentil2017DAL-0.8
    Ramon Sessions2017CHO-0.8
    Marcus Morris2017DET-0.8
    Paul Zipser2017CHI-0.8
    Shelvin Mack2017UTA-0.8
    Jordan Clarkson2017LAL-0.8
    Michael Gbinije2017DET-0.8
    Corey Brewer2017TOT-0.8
    Iman Shumpert2018CLE-0.8
    Gary Payton II2018TOT-0.8
    R.J. Hunter2018HOU-0.8
    Tyler Ennis2018LAL-0.8
    London Perrantes2018CLE-0.8
    Tyler Dorsey2018ATL-0.8
    Walt Lemon Jr.2018NOP-0.8
    Furkan Korkmaz2018PHI-0.8
    Ömer Aşık2018TOT-0.8
    Kadeem Allen2018BOS-0.8
    John Holland2018CLE-0.8
    Kristaps Porziņģis2018NYK-0.8
    Quincy Pondexter2018CHI-0.8
    Charles Cooke2018NOP-0.8
    Isaiah Whitehead2018BRK-0.8
    Tim Frazier2018WAS-0.8
    Jalen Jones2018TOT-0.8
    Willie Cauley-Stein2018SAC-0.8
    Austin Rivers2018LAC-0.8
    Jarell Martin2018MEM-0.8
    Cory Joseph2018IND-0.8
    Bruno Caboclo2018TOT-0.8
    Brandon Ingram2018LAL-0.8
    Udonis Haslem2018MIA-0.8
    Justin Holiday2018CHI-0.8
    Ramon Sessions2018TOT-0.8
    Jeff Teague2019MIN-0.8
    Keita Bates-Diop2019MIN-0.8
    Dillon Brooks2019MEM-0.8
    MarShon Brooks2019MEM-0.8
    Džanan Musa2019BRK-0.8
    Troy Brown Jr.2019WAS-0.8
    Jason Smith2019TOT-0.8
    Iman Shumpert2019TOT-0.8
    Naz Mitrou-Long2019UTA-0.8
    DeVaughn Akoon-Purcell2019DEN-0.8
    Rodney McGruder2019MIA-0.8
    Tim Hardaway Jr.2019TOT-0.8
    Jacob Evans2019GSW-0.8
    Harry Giles2019SAC-0.8
    Evan Turner2019POR-0.8
    Lance Thomas2019NYK-0.8
    Kenrich Williams2019NOP-0.8
    Wendell Carter Jr.2019CHI-0.8
    Luc Mbah a Moute2019LAC-0.8
    Dante Exum2019UTA-0.8
    Sviatoslav Mykhailiuk2019TOT-0.8
    Daniel Hamilton2019ATL-0.8
    Trae Young2019ATL-0.8
    Dewan Hernandez2020TOR-0.8
    Naz Mitrou-Long2020IND-0.8
    Malcolm Brogdon2020IND-0.8
    Zach Collins2020POR-0.8
    Frank Mason III2020MIL-0.8
    Terrance Ferguson2020OKC-0.8
    Garrett Temple2020BRK-0.8
    Jrue Holiday2020NOP-0.8
    Kevin Porter Jr.2020CLE-0.8
    D.J. Wilson2020MIL-0.8
    Reggie Bullock2020NYK-0.8
    T.J. Leaf2020IND-0.8
    Andre Iguodala2020MIA-0.8
    Matthew Dellavedova2020CLE-0.8
    Lonnie Walker2020SAS-0.8
    Stanley Johnson2020TOR-0.8
    Cody Martin2020CHO-0.8
    Patrick McCaw2020TOR-0.8
    Kadeem Allen2020NYK-0.8
    Carsen Edwards2020BOS-0.8
    Darius Bazley2020OKC-0.8
    Romeo Langford2020BOS-0.8
    Frank Jackson2020NOP-0.8
    Shayne Whittington2016IND-0.9
    Tim Frazier2016TOT-0.9
    Tony Snell2016CHI-0.9
    James Anderson2016SAC-0.9
    Corey Brewer2016HOU-0.9
    Josh McRoberts2016MIA-0.9
    Dennis Schröder2016ATL-0.9
    DeJuan Blair2016WAS-0.9
    JaKarr Sampson2016TOT-0.9
    Tibor Pleiß2016UTA-0.9
    Johnny O’Bryant2016MIL-0.9
    Cleanthony Early2016NYK-0.9
    Noah Vonleh2016POR-0.9
    Fred VanVleet2017TOR-0.9
    Stephen Zimmerman2017ORL-0.9
    Rondae Hollis-Jefferson2017BRK-0.9
    Dennis Schröder2017ATL-0.9
    A.J. Hammons2017DAL-0.9
    Raymond Felton2017LAC-0.9
    Jordan Hill2017MIN-0.9
    Darrun Hilliard2017DET-0.9
    Alec Burks2017UTA-0.9
    Tim Frazier2017NOP-0.9
    Boris Diaw2017UTA-0.9
    Henry Ellenson2017DET-0.9
    Robert Covington2017PHI-0.9
    Jonathon Simmons2017SAS-0.9
    Rashad Vaughn2017MIL-0.9
    Jarell Martin2017MEM-0.9
    Jrue Holiday2017NOP-0.9
    Marcelo Huertas2017LAL-0.9
    Damian Jones2017GSW-0.9
    Derrick Favors2017UTA-0.9
    Brandon Jennings2018MIL-0.9
    Jameer Nelson2018TOT-0.9
    Larry Drew II2018TOT-0.9
    Myke Henry2018MEM-0.9
    Patrick McCaw2018GSW-0.9
    Elfrid Payton2018TOT-0.9
    Raymond Felton2018OKC-0.9
    Josh Huestis2018OKC-0.9
    Darrun Hilliard2018SAS-0.9
    Jon Leuer2018DET-0.9
    Bobby Brown2018HOU-0.9
    Isaiah Hicks2018NYK-0.9
    Zach Randolph2018SAC-0.9
    Dwayne Bacon2018CHO-0.9
    Dwight Buycks2018DET-0.9
    Aaron Gordon2018ORL-0.9
    Jason Smith2018WAS-0.9
    Justin Patton2019PHI-0.9
    Khyri Thomas2019DET-0.9
    Kosta Koufos2019SAC-0.9
    Donovan Mitchell2019UTA-0.9
    Ron Baker2019TOT-0.9
    Allen Crabbe2019BRK-0.9
    Andre Drummond2019DET-0.9
    Aaron Gordon2019ORL-0.9
    Ian Clark2019NOP-0.9
    Shaquille Harrison2019CHI-0.9
    James Johnson2019MIA-0.9
    Edmond Sumner2019IND-0.9
    Donatas Motiejūnas2019SAS-0.9
    Tyrone Wallace2019LAC-0.9
    Terry Rozier2019BOS-0.9
    Austin Rivers2019TOT-0.9
    Elie Okobo2019PHO-0.9
    Stanton Kidd2020UTA-0.9
    Zhaire Smith2020PHI-0.9
    Quinndary Weatherspoon2020SAS-0.9
    Vince Carter2020ATL-0.9
    PJ Dozier2020DEN-0.9
    Devonte’ Graham2020CHO-0.9
    Kelan Martin2020MIN-0.9
    Marcus Smart2020BOS-0.9
    Edmond Sumner2020IND-0.9
    Kyle Kuzma2020LAL-0.9
    Michael Frazier2020HOU-0.9
    Gary Harris2020DEN-0.9
    Sterling Brown2020MIL-0.9
    Josh Richardson2020PHI-0.9
    Gary Payton II2020WAS-0.9
    Alfonzo McKinnie2020CLE-0.9
    Ish Smith2020WAS-0.9
    Anfernee Simons2020POR-0.9
    Jerome Robinson2020TOT-0.9
    Bobby Portis2020NYK-0.9
    Bruce Brown2020DET-0.9
    DeAndre’ Bembry2020ATL-0.9
    Kris Dunn2020CHI-0.9
    P.J. Hairston2016TOT-1
    Lou Amundson2016NYK-1
    Elton Brand2016PHI-1
    Kendall Marshall2016PHI-1
    Elijah Millsap2016UTA-1
    Phil Pressey2016TOT-1
    Jarrett Jack2016BRK-1
    Jerami Grant2016PHI-1
    Dion Waiters2016OKC-1
    Chris McCullough2016BRK-1
    Randy Foye2016TOT-1
    Jordan Hamilton2016NOP-1
    Iman Shumpert2016CLE-1
    Jeff Green2017ORL-1
    Diamond Stone2017LAC-1
    Alonzo Gee2017DEN-1
    Devin Booker2017PHO-1
    Julius Randle2017LAL-1
    T.J. McConnell2017PHI-1
    J.R. Smith2017CLE-1
    Sasha Vujačić2017NYK-1
    Marcus Thornton2017WAS-1
    Kent Bazemore2017ATL-1
    Monta Ellis2017IND-1
    Georges Niang2017IND-1
    Caris LeVert2018BRK-1
    Cameron Payne2018CHI-1
    Tony Parker2018SAS-1
    Georgios Papagiannis2018TOT-1
    Tyrone Wallace2018LAC-1
    Malachi Richardson2018TOT-1
    Alan Williams2018PHO-1
    Aron Baynes2018BOS-1
    Vander Blue2018LAL-1
    Dorian Finney-Smith2018DAL-1
    Kyle Collinsworth2018DAL-1
    Malik Monk2018CHO-1
    Johnny O’Bryant2018CHO-1
    Justise Winslow2018MIA-1
    Norman Powell2018TOR-1
    Tony Parker2019CHO-1
    Isaiah Briscoe2019ORL-1
    Andrew Harrison2019TOT-1
    Bruce Brown2019DET-1
    Melvin Frazier2019ORL-1
    Chimezie Metu2019SAS-1
    Devonte’ Graham2019CHO-1
    Carmelo Anthony2019HOU-1
    Wade Baldwin2019POR-1
    Lorenzo Brown2019TOR-1
    D’Angelo Russell2019BRK-1
    Andre Ingram2019LAL-1
    Quincy Acy2019PHO-1
    Ángel Delgado2019LAC-1
    Ricky Rubio2019UTA-1
    Josh Okogie2019MIN-1
    Shelvin Mack2019TOT-1
    Brandon Knight2019TOT-1
    Justin Wright-Foreman2020UTA-1
    Ignas Brazdeikis2020NYK-1
    Marial Shayok2020PHI-1
    Džanan Musa2020BRK-1
    Naz Reid2020MIN-1
    C.J. Miles2020WAS-1
    Vic Law2020ORL-1
    Allen Crabbe2020TOT-1
    Ty Jerome2020PHO-1
    Dion Waiters2020TOT-1
    Jordan McRae2020TOT-1
    Frank Ntilikina2020NYK-1
    Miles Bridges2020CHO-1
    Thaddeus Young2020CHI-1
    Nickeil Alexander-Walker2020NOP-1
    D’Angelo Russell2016LAL-1.1
    Dahntay Jones2016CLE-1.1
    Xavier Munford2016MEM-1.1
    Adreian Payne2016MIN-1.1
    Rajon Rondo2016SAC-1.1
    Justise Winslow2016MIA-1.1
    Anthony Brown2016LAL-1.1
    Monta Ellis2016IND-1.1
    Ryan Kelly2016LAL-1.1
    DeMarre Carroll2016TOR-1.1
    Jonathan Gibson2017DAL-1.1
    Kay Felder2017CLE-1.1
    Jake Layman2017POR-1.1
    Joakim Noah2017NYK-1.1
    Elfrid Payton2017ORL-1.1
    Terry Rozier2017BOS-1.1
    Robin Lopez2017CHI-1.1
    Justin Harper2017PHI-1.1
    Reggie Jackson2017DET-1.1
    Jahlil Okafor2017PHI-1.1
    Donatas Motiejūnas2017NOP-1.1
    Andrew Nicholson2017TOT-1.1
    D’Angelo Russell2017LAL-1.1
    Ron Baker2017NYK-1.1
    Metta World Peace2017LAL-1.1
    Tyreke Evans2017TOT-1.1
    Frank Kaminsky2017CHO-1.1
    Zach Collins2018POR-1.1
    Marquese Chriss2018PHO-1.1
    James Webb III2018BRK-1.1
    Andrew White2018ATL-1.1
    Caleb Swanigan2018POR-1.1
    Isaiah Taylor2018ATL-1.1
    Joe Johnson2018TOT-1.1
    Jaylen Morris2018ATL-1.1
    Kobi Simmons2018MEM-1.1
    Skal Labissière2018SAC-1.1
    Abdel Nader2018BOS-1.1
    Jamel Artis2018ORL-1.1
    Chandler Parsons2019MEM-1.1
    Antonio Blakeney2019CHI-1.1
    Michael Carter-Williams2019TOT-1.1
    Emmanuel Mudiay2019NYK-1.1
    Julian Washburn2019MEM-1.1
    Cory Joseph2019IND-1.1
    Ryan Anderson2019TOT-1.1
    Kent Bazemore2019ATL-1.1
    Kostas Antetokounmpo2019DAL-1.1
    Jared Terrell2019MIN-1.1
    Justise Winslow2019MIA-1.1
    Avery Bradley2019TOT-1.1
    Wayne Selden2019TOT-1.1
    Rajon Rondo2020LAL-1.1
    Lance Thomas2020BRK-1.1
    De’Anthony Melton2020MEM-1.1
    Jordan Bone2020DET-1.1
    Kevin Hervey2020OKC-1.1
    Jerian Grant2020WAS-1.1
    Kent Bazemore2020TOT-1.1
    Chandler Parsons2020ATL-1.1
    Kenrich Williams2020NOP-1.1
    Nicolas Batum2020CHO-1.1
    Jordan Adams2016MEM-1.2
    Devyn Marble2016ORL-1.2
    Joe Young2016IND-1.2
    John Wall2016WAS-1.2
    Rashad Vaughn2016MIL-1.2
    Metta World Peace2016LAL-1.2
    Bobby Portis2016CHI-1.2
    Spencer Dinwiddie2016DET-1.2
    Nikola Peković2016MIN-1.2
    Evan Turner2017POR-1.2
    Ronnie Price2017PHO-1.2
    Greivis Vásquez2017BRK-1.2
    Luol Deng2017LAL-1.2
    Dragan Bender2017PHO-1.2
    Lance Stephenson2017TOT-1.2
    Brandon Knight2017PHO-1.2
    Nigel Hayes2018TOT-1.2
    Lance Stephenson2018IND-1.2
    Derrick Rose2018TOT-1.2
    Reggie Jackson2018DET-1.2
    Mario Chalmers2018MEM-1.2
    Bonzie Colson2019MIL-1.2
    Goran Dragić2019MIA-1.2
    Isaac Bonga2019LAL-1.2
    Treveon Graham2019BRK-1.2
    Tony Bradley2019UTA-1.2
    Trey Lyles2019DEN-1.2
    DeAndre’ Bembry2019ATL-1.2
    Dirk Nowitzki2019DAL-1.2
    Dennis Schröder2019OKC-1.2
    J.P. Macura2019CHO-1.2
    Jawun Evans2019TOT-1.2
    De’Anthony Melton2019PHO-1.2
    Bobby Portis2019TOT-1.2
    Dejounte Murray2020SAS-1.2
    Brandon Knight2020TOT-1.2
    Michael Kidd-Gilchrist2020TOT-1.2
    Tristan Thompson2020CLE-1.2
    Treveon Graham2020TOT-1.2
    Jarrell Brantley2020UTA-1.2
    De’Andre Hunter2020ATL-1.2
    Drew Gooden2016WAS-1.3
    Thomas Robinson2016BRK-1.3
    Jameer Nelson2016DEN-1.3
    O.J. Mayo2016MIL-1.3
    Tyler Ulis2017PHO-1.3
    Toney Douglas2017MEM-1.3
    Dwyane Wade2017CHI-1.3
    Andrew Bogut2017TOT-1.3
    Jusuf Nurkić2017TOT-1.3
    Isaiah Taylor2017HOU-1.3
    Mario Hezonja2017ORL-1.3
    Anthony Brown2017TOT-1.3
    Al-Farouq Aminu2017POR-1.3
    Michael Carter-Williams2018CHO-1.3
    Jarrett Jack2018NYK-1.3
    Jusuf Nurkić2018POR-1.3
    Dennis Schröder2018ATL-1.3
    Marc Gasol2018MEM-1.3
    Paul Zipser2018CHI-1.3
    Antonio Blakeney2018CHI-1.3
    Dwyane Wade2019MIA-1.3
    Billy Garrett2019NYK-1.3
    Caris LeVert2019BRK-1.3
    Victor Oladipo2019IND-1.3
    Gary Trent Jr.2019POR-1.3
    Isaac Humphries2019ATL-1.3
    Marquese Chriss2019TOT-1.3
    Stanley Johnson2019TOT-1.3
    Tim Frazier2020DET-1.3
    Draymond Green2020GSW-1.3
    Deonte Burton2020OKC-1.3
    Andrew Wiggins2020TOT-1.3
    Carmelo Anthony2020POR-1.3
    Evan Turner2020ATL-1.3
    Jacob Evans2020TOT-1.3
    Ky Bowman2020GSW-1.3
    Eric Gordon2020HOU-1.3
    Markelle Fultz2020ORL-1.3
    Lonzo Ball2020NOP-1.3
    Aaron Gordon2020ORL-1.3
    Kevin Knox2020NYK-1.3
    Alex Stepheson2016TOT-1.4
    Terry Rozier2016BOS-1.4
    Kevin Séraphin2016NYK-1.4
    Marcus Smart2016BOS-1.4
    Michael Carter-Williams2016MIL-1.4
    Josh Richardson2017MIA-1.4
    Pierre Jackson2017DAL-1.4
    Tony Allen2017MEM-1.4
    Sergio Rodríguez2017PHI-1.4
    Malcolm Delaney2017ATL-1.4
    Trey Lyles2017UTA-1.4
    Mike Tobey2017CHO-1.4
    Andrew Harrison2017MEM-1.4
    Domantas Sabonis2017OKC-1.4
    Andre Drummond2017DET-1.4
    Semaj Christon2017OKC-1.4
    Damion Lee2018ATL-1.4
    Dwyane Wade2018TOT-1.4
    Stanley Johnson2018DET-1.4
    Frank Mason III2018SAC-1.4
    Tyler Ulis2018PHO-1.4
    Will Barton2019DEN-1.4
    Mario Hezonja2019NYK-1.4
    Dairis Bertāns2019NOP-1.4
    Udonis Haslem2019MIA-1.4
    Ish Smith2019DET-1.4
    J.R. Smith2020LAL-1.4
    B.J. Johnson2020ORL-1.4
    Hamidou Diallo2020OKC-1.4
    Lorenzo Brown2016PHO-1.5
    Jared Sullinger2016BOS-1.5
    Josh Smith2016TOT-1.5
    Brandon Jennings2017TOT-1.5
    Patricio Garino2017ORL-1.5
    Rodney Stuckey2017IND-1.5
    Mike Scott2017ATL-1.5
    Nikola Vučević2017ORL-1.5
    Dion Waiters2017MIA-1.5
    Kris Dunn2017MIN-1.5
    Stanley Johnson2017DET-1.5
    Lamar Patterson2017ATL-1.5
    Norris Cole2017OKC-1.5
    Zhou Qi2018HOU-1.5
    Davon Reed2018PHO-1.5
    Carmelo Anthony2018OKC-1.5
    Jonathan Isaac2018ORL-1.5
    Jawun Evans2018LAC-1.5
    John Wall2018WAS-1.5
    John Wall2019WAS-1.5
    J.J. Barea2019DAL-1.5
    Elfrid Payton2019NOP-1.5
    J.R. Smith2019CLE-1.5
    Jevon Carter2019MEM-1.5
    Rajon Rondo2019LAL-1.5
    Lonzo Ball2019LAL-1.5
    William Howard2020HOU-1.5
    Luka Šamanić2020SAS-1.5
    Kevon Looney2020GSW-1.5
    Dillon Brooks2020MEM-1.5
    Norris Cole2016NOP-1.6
    Greivis Vásquez2016MIL-1.6
    Dario Šarić2017PHI-1.6
    Isaiah Whitehead2017BRK-1.6
    Josh McRoberts2017MIA-1.6
    Ish Smith2017DET-1.6
    DeAndre’ Bembry2018ATL-1.6
    Emmanuel Mudiay2018TOT-1.6
    Kay Felder2018TOT-1.6
    Russell Westbrook2018OKC-1.6
    Dejounte Murray2018SAS-1.6
    Mike James2018TOT-1.6
    Jonathon Simmons2019TOT-1.6
    Caleb Swanigan2019TOT-1.6
    Iman Shumpert2020BRK-1.6
    Dewayne Dedmon2020TOT-1.6
    Coby White2020CHI-1.6
    Devon Hall2020OKC-1.6
    Justin Anderson2020BRK-1.6
    Tyrone Wallace2020ATL-1.6
    Bruno Caboclo2016TOR-1.7
    Alex Len2016PHO-1.7
    Briante Weber2016TOT-1.7
    Andre Drummond2016DET-1.7
    Wade Baldwin2017MEM-1.7
    Chandler Parsons2017MEM-1.7
    Brandon Ingram2017LAL-1.7
    Marcus Smart2017BOS-1.7
    D’Angelo Russell2018BRK-1.7
    Andrew Wiggins2018MIN-1.7
    Yuta Watanabe2019MEM-1.7
    Collin Sexton2019CLE-1.7
    Rawle Alkins2019CHI-1.7
    Jerryd Bayless2019MIN-1.7
    Dennis Smith Jr.2019TOT-1.7
    Tyreke Evans2019IND-1.7
    Joe Chealey2020CHO-1.7
    Marvin Bagley III2020SAC-1.7
    Andre Drummond2020TOT-1.7
    Cam Reddish2020ATL-1.7
    Sekou Doumbouya2020DET-1.7
    Russell Westbrook2020HOU-1.7
    Elfrid Payton2016ORL-1.8
    Markieff Morris2016TOT-1.8
    Joakim Noah2016CHI-1.8
    Jared Sullinger2017TOR-1.8
    Chinanu Onuaku2018HOU-1.8
    Solomon Hill2018NOP-1.8
    Frank Ntilikina2018NYK-1.8
    Zach LaVine2018CHI-1.8
    Avery Bradley2018TOT-1.8
    Julius Randle2020NYK-1.8
    Tremont Waters2020BOS-1.8
    Caris LeVert2020BRK-1.8
    Julius Randle2016LAL-1.9
    Orlando Johnson2016TOT-1.9
    Gary Payton II2017MIL-1.9
    Gary Neal2017ATL-1.9
    Rajon Rondo2017CHI-1.9
    Zach Randolph2017MEM-1.9
    Rodney Purvis2018ORL-1.9
    Josh Jackson2019PHO-1.9
    Walt Lemon Jr.2019CHI-1.9
    Jemerrio Jones2019LAL-1.9
    Darius Garland2020CLE-1.9
    Taurean Prince2020BRK-1.9
    Stanley Johnson2016DET-2
    Cameron Payne2017TOT-2
    Isaiah Thomas2018TOT-2
    Milton Doyle2018BRK-2
    Marcus Smart2018BOS-2
    Andre Roberson2020OKC-2
    Jarrett Culver2020MIN-2
    Victor Oladipo2020IND-2
    Gabe Vincent2020MIA-2
    Theo Pinson2020BRK-2
    Elfrid Payton2020NYK-2
    Derrick Rose2016CHI-2.1
    Kobe Bryant*2016LAL-2.1
    Ish Smith2016TOT-2.1
    Michael Carter-Williams2017CHI-2.1
    Manny Harris2017DAL-2.1
    Kris Dunn2018CHI-2.1
    Rondae Hollis-Jefferson2019BRK-2.1
    Kris Dunn2019CHI-2.1
    Markelle Fultz2019PHI-2.1
    Frank Ntilikina2019NYK-2.1
    Al-Farouq Aminu2020ORL-2.1
    Jusuf Nurkić2016DEN-2.2
    Emmanuel Mudiay2017DEN-2.2
    De’Aaron Fox2018SAC-2.2
    Josh Jackson2018PHO-2.2
    Dion Waiters2018MIA-2.3
    Isaiah Thomas2019DEN-2.3
    Jordan Poole2020GSW-2.3
    Dwayne Bacon2020CHO-2.3
    Elijah Millsap2017PHO-2.4
    Aaron Harrison2018DAL-2.4
    Andrew Wiggins2019MIN-2.4
    Russell Westbrook2019OKC-2.5
    Lonzo Ball2018LAL-2.6
    Kevin Knox2019NYK-2.6
    Jimmer Fredette2019PHO-2.6
    Dennis Smith Jr.2020NYK-2.6
    RJ Barrett2020NYK-2.6
    Dusty Hannahs2019MEM-2.7
    Blake Griffin2020DET-2.8
    Jerryd Bayless2017PHI-2.9
    Markelle Fultz2018PHI-2.9
    Aaron Jackson2018HOU-2.9
    Dennis Smith Jr.2018DAL-2.9
    Justise Winslow2020MIA-3.1
    Duje Dukan2016SAC-3.2
    Marquis Teague2018MEM-3.4
    Josh Gray2018PHO-3.4
    Emmanuel Mudiay2016DEN-3.5
    Tony Wroten2016PHI-3.6
    Justise Winslow2017MIA-4.3
    Xavier Rathan-Mayes2018MEM-4.3

    Curry’s second MVP campaign was an outlier among outliers, with a z-score of 7.2 standard deviations above league-average over the five-year sample. The data was approximately normal, but with a steep curve (standard deviation of 0.9), so the abnormal z-score isn’t simply anomalous; it was a season for the ages! 99.7% of seasons clocked in between scores of -2.9 and 2.5, so the scores that grace the front page of the table represent the cream of the crop of player seasons. Interestingly, James Harden’s 2019 season finishes eleventh as his second-best scoring season despite posting the highest scoring rate in league history. This exemplifies the importance of efficiency to the metric; because after all, a shot missed is of equal magnitude to a shot made. The traditional criteria for comparing volume against average efficiency is likely undervaluing the effects of missed field goals.

    How is Scorer Rating different from Scoring Value? Well, Curry’s 2016 score of 6.4 points is nearly double that of his 3.3 points in ScoreVal, so the aesthetic disparity is clear enough. But, conceptually, what sets these two metrics apart? ScoreVal is actually drawn from the scoring component of a Box Plus/Minus model, so the metric is derived from a regression model. Scorer Rating was created as a standalone metric based on theory and expected values, separate from how different scoring statistics relate to a player’s impact. Comparatively, the player rankings of the two metrics are quite similar, but there’s an inherent disagreement on point values. While ScoreVal’s formula is proprietary, Scorer Rating uses a universal counting principle. For example, if Stephen Curry had 23.8 scoring possessions per 100 team possessions and averaged 0.267 points per possessions relative to league-average, then his raw score is the product of those two. ScoreVal seems to use efficiency in a percentage like true shooting. If a player averages 1.2 points per true-shooting attempt, his TS% is 60%. 

    We can look at how the importance of volume and efficiency has changed over the past five years. During the 2015-16 season, volume had a surprisingly low relationship with Scorer Rating, posting a correlation coefficient of 0.43 while TS% was moderately stronger: 0.58. At the player level, the gap between the two scores is enough to suggest efficiency was more important in that season, but we can continue with further seasons to track any notable changes. Volume held slightly-more significance in 2017 with an r-value of 0.49 while efficiency was almost identical to its 2016 value: 0.59. The gap does lessen, but the trend holds: efficiency is, at least, just as important. (Fun fact: Russell Westbrook led the league in scoring rate that season at 33.6 points per 75, but posted a Scorer Rating of just 0.3 points because of mild efficiency.)

    Stephen Curry’s league-leading efficiency and volume made him the most valuable scorer of the second-half of the decade.

    Neither efficiency nor volume alone was very indicative of a player’s scoring value in 2018. The efficiency coefficient fell to 0.44 while its volume counterpart also dropped to 0.31. The season may not have been full of descriptive power, but let’s not gloss over the fact that Stephen Curry was a James Harden away from leading the league in scoring rate and efficiency once again! Efficiency again seems to be losing value from its previous seasons as its relationship with Scorer Rating falls just under 0.5 at 0.48 and volume takes a rise to 0.38. The clear message with these four seasons is that importance fluctuates from year-to-year, but a strong assertion holds: efficiency is drastically undervalued in evaluating scoring. The nail in the coffin was this last season, in which volume had a typical correlation of 0.41 while efficiency skyrockets to 0.6! A lesson is taught by Scorer Rating: the tendency to neglect efficiency for high volume is a blur to a player’s true value as a scorer.

    The other route to go about comparing efficiency and volume is conceptual. How else can we interpret the results of Scorer Rating’s relationships with volume and efficiency? For one, it confirms a belief I’d held since the Harden debacle in the prospect of his trade to the Miami Heat. High-volume scoring doesn’t easily evolve on greater and greater offenses. A diminishing returns effect kicks in quite fast on these less-scalable traits. Unless that scorer is a Harden-like player, who eats into teammates’ possessions, his scoring rate will see a notable decrease. Therefore, volume scoring is more of a floor-raising skill. It’s most valuable on teams with poor to mediocre offenses and good to great defenses, in need of that scoring boost to truly take off. Efficiency, on the other hand, is the ceiling-raising technique. Given the relatively small range of scoring attempts among teams, being able to capitalize through efficiency is a safer bet to post a highly-efficient offense.

    Allen Iverson: a perfect example of a high-volume, floor-raising scorer.

    There’s one last thing to consider when it comes to a player’s scoring value: it’s not the same as his scoring abilities. A second diminishing returns effect we haven’t yet discussed relates to a player’s efficiency and shot frequency: more attempts equals lower efficiency. This is a traditionally-accepted concept that explains why all 100% shooters usually take three total shots or less. A player like Duncan Robinson may not be able to replicate his 64.3 scoring percentage on more than his actual 11 attempts per game, but in terms of how his scoring impacted the scoreboard, he’s among the top of the league. It’s entirely valid to assign a higher value to volume when choosing the league’s most talented scorers, but it’d be unwise to forget about efficiency in any scenario…

    … and, Stephen Curry’s 2016 was the greatest season for a scorer in NBA history.


  • How the 1960s Reveal the Red Herrings of Today

    How the 1960s Reveal the Red Herrings of Today

    Last week, I posted a discussion in which I stated Bill Russell was a greater “statistical” player compared to Wilt Chamberlain. Expectantly, most replies were in disagreement. The general framework of my opposition would go as follows:

    Chamberlain averaged more points, rebounds, and assists per game than Russell on a higher true shooting percentage. Is that not enough? Chamberlain accrued 247.3 Win Shares in his career while Russell managed 163.5. But Russell played fewer seasons, so this may not be a fair comparison. Chamberlain contributed .248 Win Shares every 48 minutes while Russell was worth .193 in the same period. “The Record Book” not only had the advantage in the box score but in advanced statistics; therefore he’s the superior “statistical” player, right?

    Ballislife

    More often than not, stats are viewed in their rawest forms. This means points per game are frequently used for cross-era comparison despite the fluctuating rates (difficulties) at which different court actions occur and the number of chances a player has to accumulate those actions (pace). When presented with the opportunity to convert per-game stats to modern values, the majority of responses are more dismissive, stating true statistical comparisons across eras are simply unfeasible. For a long time, this was thought to be true. It wasn’t until the work of analytical pioneers that we were given a good idea as to what an “n” points-per-game scorer in 1970 would average fifty years later.

    “Inflation-adjusted” statistics emerged to widespread attention just last year, and the results have been extremely promising… and unemployed. The classic example of converting historical values to modern values is Chamberlain’s 50 points-per-game season. It’s mostly recognized that “The Dipper’s” scoring production wouldn’t equate to the same degree in later times, but exactly how much would his 50.4 points per game change? To start, we’d convert points per game to points per-100 (possessions) using Chamberlain’s raw points per game and his team’s number of possessions per game. (Minutes for teams weren’t calculated until the mid-60s, so we’re praying teams didn’t pass too far over the 48 minutes per game threshold). Chamberlain averaged 38.0 points per 100 possessions, which would rank eighth in the league today. He’s often criticized for such, but here we’ll incorporate a key element of adjusting for inflation: it was harder to score a point back then than it is now.

    NBA.com

    During the 1962 season, offenses scored 93.6 points every 100 possessions, a clear downgrade from 2020’s average offensive rating of 110.6 points. Based on these rates, we can incorporate a factor to weigh ’62 scoring to ’20 scoring. Chamberlain scored 45.4 “inflation-adjusted” points every 100 possessions. If he played in today’s game, “Wilt the Stilt” would average roughly 34.1 points per 75 possessions. Despite his raw scoring rate, Chamberlain’s season was still historical, and he’d likely remain the league’s top volume scorer in any given season using these conversions. The last step is to determine how often he’d be on the court; no star would match Chamberlain’s 48.5 minutes per contest nowadays. The standard protocol in this situation is to compare the average of the top-16 minutes per game in 1962 (40.2) to that of 2020 (35.6). Chamberlain would play approximately 43 minutes per game, from which we can estimate he’d score 40.6 points per game in 2020.

    These adjustments, although entirely valid, are met with knee-jerk reactions. People tend to work against these measurements to, instead, remain with a more traditional criterion. It’s likely due to the figures from which people are informed; basketball knowledge is generally passed down from generation to generation, so one’s aggregate views won’t likely stray too far away from its predecessor. A portion of a generation’s population is the one to make the advancements we’re familiar with today: metrics like Win Shares and play-by-play data. Today, our best achievement is Regularized Adjusted Plus/Minus (RAPM), and more specifically, Jeremias Engelmann’s PI RAPM. Resultantly, plus/minus data receive a lot of pushback compared to, say, Win Shares: a metric that’s more easily interpretable (e.g. “Player A” has 7 Win Shares, he contributed 7 wins). But a more foreign concept like Plus/Minus is then met with a higher degree of conflict.

    Tableau Public

    It’s due to the aforementioned reasons that Wilt Chamberlain is ubiquitously recognized as a superior statistical player to Bill Russell. He checks the boxes of greater raw box scores and a greater score in the most popular and explicit advanced statistic. There are multiple drawbacks to this approach. Earlier, we discussed how statistics are often viewed in their rawest forms, and that still holds true; a very small portion of basketball critics are familiar with statistical adjustments to compare box scores across several decades. But the even larger misconception is the value of the box score. Recently, I plotted the correlation between six samples of three-year luck-adjusted RAPM (from Ryan Davis) and three-year box scores. The offensive component held a moderately-strong r-value; but, expectantly, defense isn’t effectively explained by the box score, making the total box score less indicative of a player’s value than the offensive half alone. Namely, the box score isn’t a strong gauge of a player’s overall value. 

    This phenomenon explains why a player like Bill Russell, a defensive superstar with minimal offensive impact, is seen as statistically inferior to a player like Wilt Chamberlain, whose offensive value dominates the box score. Statistics like points, assists, turnovers, and field goals are a few of many that measure a player’s offensive court actions. The intuitive and statistical explanatory power of the offensive box score is greater than that of the defensive box score, and most are aware; even those who use the box score as a primary reference of value know steals, blocks, and defensive rebounds are often poor indicators of defensive impact. However, this means offense receives far more consideration than defense in cases like award recognition and player-ranking lists. Offense is easier to quantify, easier to understand, and it often leaves defense in the dust. The lack of evaluator metrics in the 1960s, let alone the lesser number of counting stats, often means older players are primarily recognized for their offense to a higher degree than current players are. 

    NBA.com

    Players like Bill Russell are in more strenuous situations in accounting for the methods with which people interpret statistics. It’s less a cause of how point values are designated; say, whether a point scored is truly worth a point to the team. Rather, it’s where the limitations of statistics are drawn. Traditionally, it stops once you start seeing player salaries on their Basketball-Reference page. This means statistical inferencing generally adheres to two categories: simple counting stats and impact metrics. After that, the rest is attributed to the eye test and logical reasoning. This approach severely diminishes the expansive methods of statistical inferencing, an example of which perfectly relates to the ’60s era of basketball: Wilt Chamberlain. He’s widely recognized as one of the greatest scorers of all-time, which he is; but the conclusions drawn from that statement vary. The box-centric approach of statistical interpretation states Chamberlain’s historic scoring makes him one of the most dominant offensive players in league history. However, there’s reason to believe these conclusions may be drawn too fast.

    James Harden started to explored trade destinations in the earlier stages of the offseason. His three most-desired suitors were the Philadelphia 76ers, Miami Heat, and Brooklyn Nets, the middle of which drew a trivial amount of noise, but it was an endorsed deal regardless. The prospect of placing the league’s best volume scorer on the most efficient postseason offense may make some sense initially. But consider the qualities that made Miami’s offense great: movement, balanced attacks, and teammate synergies. If Harden were in that lineup, he’d disrupt all of them. He’s the purest “black hole” on offense, in the 99th percentile of average seconds per touch. If any player in the league eats into teammates’ possessions more than the rest, it’s Harden. His high-usage style would take away from the variety of contributors the Heat would employ in the Playoff’s later rounds. With the decreasing frequency of possessions among teammates, the chemistry of those synergies would also decline. The acquisition of Harden would have put a cap on the Heat’s offensive ceiling, yet they were a team in no need of more scoring.

    The impact of volume scoring is overstated by the box score, and the great Wilt Chamberlain is no exception. Ben Taylor’s exploratory analysis of Big Musty’s career gave a piece of evidence that was a nail in the coffin for me to make a verdict on the Harden paradigm: there was an extremely-negative correlation between Chamberlain’s shot frequency and his team’s offensive performance. During his thirty-five-to-fifty points-per-game seasons, Chamberlain’s team offenses were often average, wavering above and below that mark at times for only a few points. When he was traded to Philadelphia and his true shooting attempts rapidly declined, their offense took off. There’s no denying the odds of some overstatements due to the unstable roster continuity of Chamberlain’s teams throughout his career, but the general trends hold: high-volume scoring is more of a floor-raising technique than a skill that will truly lift an offense to historical greatness. These concepts are a large part of what makes statistical inferencing so valuable, and the face-value examinations of the box score work against them.

    Backpicks

    If we apply the same criteria to Russell, determining how certain playstyles relate to team success, we see the opposite: his defensive dominance unlocked historical team defenses. (Due credit to @pdx on Discuss TheGame, who was the one to introduce me to this Russell career trend.) The season before Russ entered the league, the Celtics had the worst-performing defense in basketball. Throw Russell into that lineup, and Boston suddenly becomes the best team defense in a year. The Celtics were an elite defense for every season of Russ’s career, not once allowing opponents to score at a rate more than four points less than league-average; but when he left, their relative defense was raised nearly seven points. Tendencies like these are far greater gauges of a player’s value than a brief overview of the box score because, after all, players only exist to improve team success. They prove a player like Chamberlain may perform well on a team deprived of scoring and in need of posting merely a good team offense, but a player like Russell possesses skills that take a team to dynastical levels. 

    How do the 1960s, specifically, prove how we incorrectly interpret statistics? More rigorous statistical methodologies can prove the superior value of a defensive anchor like Bill Russell over a scoring machine like the Big Dipper during an era that was dominated by scoring and without records of defensive counting statistics during good chunks of either players’ career. Despite the lack of full box scores and impact metrics of today, there are still strong measures to gauge the effects of a player’s skills on his team. All it takes is a little more digging.


  • Examining Potential Trade Suitors for Russell Westbrook

    Examining Potential Trade Suitors for Russell Westbrook

    Recent news marked back-to-back offseasons in which Russell Westbrook has requested a trade from his team. The results that followed last year’s trade, which sent him to the Houston Rockets, has brought Westbrook’s trade value to its lowest point in years. His new team finished the regular season with a +3.1 SRS, a significant decrease from its +5.0 mark the season before. The big takeaway from Westbrook’s tie in Houston was that he’s one of the least “scalable” players in the league. Perhaps this was overstated due to playing alongside James Harden, another ball-dominant offensive superstar, who was in the 99th percentile in average seconds per touch according to Second Spectrum. But a theme remained clear: it’s becoming much harder for Westbrook to impact better and better teams while his conflicting playstyle is intact. Evidently, the likely trade suitors for him are poorer teams. Names include the Knicks (-6.7 SRS), Pistons (-4.4 SRS), Hornets (-7 SRS), and Magic (-0.9 SRS). Would a trade to any of these teams make sense?

    Most likely, yes. Westbrook is still a very good player, but as mentioned earlier, his playstyle could possibly be a hindrance to a great team trying to win a title. So it makes a lot of sense to send Westbrook to a mediocre or a poor team. Not only would Westbrook get to operate under more ideal circumstances, but a team would get a highly-effective offensive player to improve its performance. Houston was an extreme case of his low portability; the squad’s offense was nearly 3.5 points per 100 more-efficient with Westbrook off the floor. But on a team like Charlotte or Detroit, away from an environment that could create such a change, he could look something like his former self. He likely wouldn’t contend for another MVP Award, but Westbrook could help a mediocre team into Playoff contention. That leaves us with the question of the day: which teams make the most sense for Westbrook, and how exactly would he impact those teams?

    New York Knicks

    Westbrook’s name had been associated with the Knicks even before his trade request, and given the abysmal state of the team’s offense, the acquisition of Westbrook could help lift New York to near-adequacy on that end. However, the team has a fairly large problem: floor inefficiency. My study on the Eastern Conference Finals last season suggested effective field-goal percentage was the most indicative of team performance among Dean Oliver’s four factors, and the Knicks certainly corroborated it.

    PBPStats

    Even without percentages, it was clear the Knicks had a lot of cold spots on the floor. A part of it was likely their shot locations. New York hasn’t yet evolved grown into the modern archetype of a three-point barrage, let alone even an average frequency. The team was very close to the lowest three-point shot frequency in the league last season, trailing the Spurs and Pacers by a mere 0.01 points. This is likely due to the Knicks’ stagnant growth in the spacing category. My spacing metric argues New York’s offense was more clogged in 2020 than it was eleven seasons ago, an obvious sign of limited offensive growth. This would likely worsen the impact Westbrook could make in the Knicks’ offense. The team had the fourth-highest shot frequency from within three feet of the basket, and Westbrook led the league in drives per game last season. With the paint already clogged, it would be harder for Westbrook’s scoring to be effective: as evident from his scoring rate in Houston, which improved by 5.4 points per 100 on the most spaced-out team in the league.

    It could be argued that a more clogged offense would promote shot selections elsewhere, but Westbrook isn’t very effective anywhere else. Relative to league average, within three feet of the basket is his most efficient range, and even then he’s below the norm. This is an especially negative sign considering he had the most efficient season from the floor in his career last year. So he fits the theme of inefficient scoring in New York, and that’s mostly a bad thing. The Knicks had a 50.1 eFG% last season, and Westbrook’s 49.3% wouldn’t exactly raise that figure without help from teammates. But another shooting range to consider is the perimeter. Could Westbrook boost the team’s distance shooting en route to a more efficient offense? Likely not. His frequency from deep was lower than it has been in nine years, posting a 3PAr+ of 43. Paired with weak efficiency (72 3P+), Westbrook’s shooting would not push the boundaries of the Knicks’ offense any further than its current state.

    However, there is a strong chance Westbrook could make a positive impact through his passing. If we ballpark his value as a passer, we can come up with an idea as to how he’d raise the ceiling of the Knicks’ offense. By taking the number of points created by Westbrook’s assists and considering the frequency at which he passed the ball, we can estimate he created 0.43 points per pass. But that doesn’t account for the shooting strengths of his teammates. Excluding Westbrook, the Rockets had a 54.8 eFG% last season, which was significantly higher than the league-average of 52.9%. Therefore, prorated to an average team, Westbrook would create around 0.416 points per pass. This is notably higher than the Knicks’ passing production, which clocked in at roughly 0.189 points per pass, one of the worst marks in the league. As the primary faciliatory, Westbrook would provide the most valuable with his passing and playmaking, both of which were understated alongside James Harden last season.

    If Westbrook were traded to the Knicks, there’s a mildly clear preliminary picture as to how he’d impact the team. He doesn’t help them on a lot of fronts including efficiency from the field and shot selection. Westbrook’s scoring would likely suffer due to a more clogged paint, but playing alongside the most ball-dominant scorer of the decade may have understated his scoring rate last season. Therefore, it’s not unreasonable to say Westbrook’s floor efficiency would decline while his scoring rate would remain stagnant. He doesn’t push the boundaries of distance scoring, and he would only mildly increase points through free-throw efficiency (76.3% last season versus the Knicks’ 69.4% as a team). But Westbrook’s passing would be a wild card. He could either push the limits and lift the Knick’s offensive rating to, say, 109 if the league-average hovers around 111, but that number could be as low as 107.5 if increasing age and emphasized weaknesses play larger roles. I’d estimate Westbrook would raise the Knicks’ offense to a middle-ground number, roughly 108 rounded to the nearest whole. The relative offense would range from around -2.5 to -3.5 points depending on the development of Westbrook’s new teammates.

    Detroit Pistons

    The Pistons are in a similar boat as the Knicks: a poor team without a clear anchor. But the good is news is that Detroit is notably better than the Knicks. The Pistons’ offense was -1.6 points worse than average compared to the Knick’s -4.1 relative offense. They’re still a net-negative team (-4.5 SRS), but Westbrook is given much more to work with. He just may be the last push the Pistons need to set forth a solid offense next season.

    PBPStats

    Detroit boasts more selective shot locations than those of the Knicks, with an apparent decrease in mid-range shots and higher frequencies in the two most efficient ranges: the paint and the perimeter. The Pistons were smack in the middle of three-point frequency last season, 15th among teams, at 38.1 three-point attempts per 100 field-goal attempts. Furthermore, the paint is far less clogged in Detroit than it is in New York, the former squad taking 3.1% fewer of their shots from within three feet of the hoop. My aforementioned spacing metric corroborates this. Detroit wasn’t necessarily a team with exceptional spacing, ranking 22nd among teams, but it’s a more desirable situation than the Knicks considering the information we’ve gone over. The positioning of Westbrook’s teammates would likely give him more room to do damage on usage possessions as well as target teammates more effectively than if he were operating in the Knicks’ offense.

    While Detroit seems to be a great place for Westbrook to revitalize his role as “the man” on a solid offense, can we confidently say he’d push the boundaries of that offense? The Pistons were dead-average in terms of floor efficiency, posting a 52.9 eFG% last season; Westbrook’s poor floor efficiency wouldn’t exactly improve that figure if he were on the team. They were one of the worst teams at limiting turnovers; Westbrook fell outside the interquartile range in adjusted turnover percentage, which couples a player’s turnover rate with how often he’s involved in the offense to level the playing field for high-usage creators. Conversely, there are two factors for which he could provide a subtle boost. Detroit was above league-average in free-throw rate, but given the average floor efficiency of the team, it’s clear last year’s offense had some form of untapped potential. Westbrook accounts for three free-throw attempts every ten field-goal attempts, a rate that was actually understated last season in Houston due to his teammates’ spacing (which equals more defenders on the perimeter and fewer in the paint, a mixture that took away Westbrook’s odds of getting the opposition into foul trouble).

    The last time Westbrook was “the man” on a team, he was accounting for four free-throw attempts per ten field-goal attempts, and given Detroit’s lack of excess spacing, Westbrook’s foul-drawing skills would be maximized as a Piston. There’s also his status as an offensive rebounder. Westbrook remains one of the elite rebounding guards in the league, grabbing 5.1% of available offensive boards last season. Detroit had a +0.1 relative offensive rebounding percentage last season, but a decent chunk of that success was due to 48 games of Andre Drummond, the elite rebounder who grabbed 15.3% of available offensive rebounds as a member of the Pistons last year. Given the state of Detroit’s roster going into next season, it’s not unreasonable to suspect the team falls below average as offensive rebounders. Westbrook’s proficiency in that aspect would, although not drastically, raise the ceiling for a team like Detroit. They were 21st in field-goal attempts per 100 possessions among teams last season, so to give the Pistons a greater chance at taking some of those shooting possessions back, more offensive rebounding could provide a notable uptick in offensive rating without having to bring in other elite talents.

    Right off the bat, I’d predict Westbrook’s fit as a Detroit Pistons surpasses that as a New York Knick. He gains the right amount of spacing for more room to operate without limiting his free-throw rate as an expense. Westbrook gives more boosts to Detroit’s offensive profile as an offensive rebounder, a free-throw scorer, and as a passer (nearly twice as many assist points created per pass as the Pistons team). We could reasonably expect jumps in scoring rate, due to a more significant role and a strong scoring environment as a member of the Pistons, and assist rate, due to his role as the primary distributor and with teammates of higher floor efficiency than those in New York. Therefore, if I were responsible for trading Westbrook to either Detroit or New York, I would trade him to Detroit. His low scalability wouldn’t be dramatically exploited alongside the teammates he’d have, retaining his stronger offensive impacts in more neutral environments. The Pistons’ offense also showed to be signaling greater potential, and given the impact Westbrook can make on a team of Detroit’s caliber, it’s not unreasonable to argue the Great Lakes State is the optimal suitor for him. We could see a similar increase in offensive rating to that of New York, but with a higher ceiling due to a more suitable situation. Detroit’s offense in 2020, with Westbrook, could be as low as 110 and as high as 112, or a -0.5 to +1 relative offense.

    Charlotte Hornets

    Similar to New York, Charlotte has been thought of as one of the most likely destinations for Westbrook: a team that’s struggling to compete for a Playoff seed without their franchise great, Kemba Walker. There are different ideas on how the acquisition of Westbrook fits the Hornets’ timetable. Are they putting their future on hold taking the burden of Westbrook’s contract and his heavier ball-dominance, or does putting an All-Star on the roster help raise the team’s possibilities? These viewpoints will vary, but it’s hard to deny the attention the media has paid to a potential trade.

    PBPStats

    The Hornets’ shot locations reveal what sets them apart from the two previous teams: spacing. The Knicks provided little to none, and although Detroit was a mild improvement, Charlotte is nearly touching league-average in the spacing metric I cited in the two earlier segments. With three players in the starting lineup with above-average three-point capabilities in Devonte’ Graham, Terry Rozier, and P.J. Washington, Westbrook is granted more than enough space to make a major offensive impact. For reference, his 2017 MVP campaign was done in an environment where defenses reacted “negatively” to the OKC offense, moving inward from the three-point line and toward the paint at an 0.069 increment, or approximately 6.9% closer to the paint relative to the three-point line. Meanwhile, the Hornets had a -0.007 “relative” Spacing. This also gives Westbrook enough defenders in the post to revitalize his more potent free-throw rates.

    Given the on-court structures of the offenses we’ve examined so far, I’d say Charlotte is the best environment for Westbrook to unleash the most of his potential impact. But how do the “goodness” and tendencies of that offense further give Westbrook chances to make a strong improvement in the Hornets’ offensive efficiency? For one, the Hornets are an extremely poor-shooting team from the field, nearly descending to Westbrook levels (50.4 eFG%). This is an area he wouldn’t exactly bolster, but one he’s good enough in that he won’t diminish his teammates’ efforts. A skill in which Westbrook is more of a “middle ground” is three-point frequency. Charlotte had a +0.015 “relative” three-point frequency, hitting them at a 35.2% clip, a few points below league average. Westbrook certainly doesn’t improve these figures with his own efforts, but his stronger role on the team would likely increase the production of his teammates, creating more open and more efficient looks when defenses are scrambling to find Westbrook in the post. As he would the majority of all the offenses we’ll look at, he’d improve Charlotte’s efforts from the charity stripe, but this time at a higher frequency and efficiency. Westbrook gets to and scores from the line at higher rates than the cumulative team results last season. 

    This seems to be a very good option for Westbrook in terms of how his skills would impact the team, but how would he raise the team’s offensive rating and put them in a better position to compete for a Playoff seed? For one, Charlotte had one of the worst offenses in the league last season, posting a -4.3 relative offensive rating, even worse than the Knicks’ efficiency I cited earlier on. It was a mark only the Warriors, a team deprived of offense due to injuries, fell under last year. This isn’t exactly a surprise; the Hornets didn’t have a true offensive anchor with Graham and Rozier running the show, or the strong bench pieces to pick up some of the slack. Therefore, Charlotte would likely be a much better team with Westbrook on the floor given their lack of offensive talent. Westbrook’s fit in the Hornets’ environment and the weaker state of the team lead me to believe he’d mesh better with teammates there than in New York while also providing more offensive value. Next to Detroit, it’s even more clear that Charlotte is in greater need of Westbrook’s impact than one of the more effective offenses in the league, especially one with a returning Blake Griffin. Westbrook’s role in the Hornets’ environment surpasses those of the Knicks or Pistons, but exactly how much better does he make Charlotte? If his efforts in 2021 result in either a low Playoff seed (unlikely) or a few SRS points higher than last season, are his talents really being put to use?

    Earlier, I estimated that Westbrook could provide a rough offensive impact of +0.5 to +1.5 points per 100, and that number would likely hold on a team of similar caliber in Charlotte. But this time, Westbrook’s in a more desirable situation with a more appropriate fit, so how does that value change? The Hornets’ offense is poor enough that I wouldn’t expect an offensive rating above 108 barring any significant teammate improvements. However, I think the floor for Westbrook’s value in Charlotte is also much higher. I’d estimate an offensive efficiency of 107 points per 100 if age starts catching up to Russ and his bandmates plateau. Therefore, I think a trade to Charlotte is the more desirable choice compared to New York, but Detroit is an interesting case. Detroit gives Westbrook the opportunity to anchor a stronger offense without having to pressure the diminishing returns in impact he experiences so often. If Detroit doesn’t improve on defense and Westbrook’s 50th percentile impact comes to play, they could play at a -1.5 SRS level, which would be just outside the Playoff picture for Eastern Conference teams this year. Given the probable improvements of several teams inside that picture like Brooklyn, as well as the ones were observed in teams like Boston and Miami, it’s reasonable to say (barring any major moves in the next few weeks) that the 50th percentile outcome for Detroit would be to miss the Playoffs. I’ll come back to further examine the ramifications of either trade later on.

    Orlando Magic

    Among rumored teams, Orlando was one of the first few to be identified as a potential suitor for Westbrook, and rightfully so. At a quick glance, the Magic are the most intriguing option for Westbrook because of their strong defense and an offense in need of a true engine. They were able to clinch a Playoff seed last season, and the current state of the East suggests they could do it again. Is this a match made in heaven or are there drawbacks to Westbrook potentially joining the Magic?

    PBPStats

    Orlando didn’t have very many creators on its team last season. D.J. Augustin was an adequate primary playmaker, having averaged 6.8 assists per 75 and creating around 7 shots for teammates per 100. Markelle Fultz, Evan Fournier, and Nikola Vučević created around 6, 6, and 5, respectively. But the Magic have yet to acquire a playmaker who can potentially take their offense over the top. Westbrook would’ve been the highest creator on the team despite heavily deflated playmaking numbers. His world-class passing would lift the team’s poor shooting (50.6 eFG%) while he could also make a positive impression with his own scoring. Westbrook’s capabilities as a half-court passer, especially into the post, would create an elite tandem with teammate Vučević, who had a strong gig going with Fultz until the season’s end. Orlando was nearly in the bottom 10% in shot frequency from within three feet of the hoop, and the upgrade from Westbrook’s interior playmaking would encourage both volume and a higher conversion rate in the sport’s most efficient zone.

    Westbrook would round the edges of the Magic’s offense perhaps as well as he would any other. He’d tease minor leaps in free-throw frequency on pace for a +0.041 clip, likely an understatement due to his aforementioned leap in expected free-throw rate. Westbrook fits the mold of Orlando’s low-frequency style from deep, and likely wouldn’t hurt that aspect as much as he would other teams with greater frequencies. But his playmaking, the capabilities of which extend across the court, would improve the team’s efficiency from three as well. Westbrook likely wouldn’t raise the Magic’s three-point efficiency to league-average unless, say, they add some better shooters in the offseason, but the boost he’d give the current roster in this respect could potentially bring their offense to league-average levels. Aside from offensive rebounding, there is the fewest number of skills in which Westbrook’s impact would be of high magnitude, the inverse of several teams preceding the Magic on this list, but the improvements he could bring to their offensive efficiency are strong enough to deem his acquisition a win on the talent front rather than fit, or how he molds and redefines the team’s tendencies.

    How would Westbrook raise the Magic’s odds to succeed? When we look back to an earlier sentiment, as to how Westbrook’s on-court impact could be an intriguing factor while a strong base behind him could limit the magnitude of his on-off splits, it’s hard to say exactly how much better Westbrook’s situation in Orlando would be than that of Charlotte or Detroit. The Magic’s strong defense and a potentially-average offense would lift them to the Playoffs almost certainly, but can we conclude Westbrook would be made the most use of? When it comes to a mixture of how he impacts the team and how the team could succeed, Orlando is the most desirable option of the four. Westbrook’s value may not be as high there as Charlotte, where he’d likely be of the most importance, but the possibility of a postseason berth would put his talents to more use. Westbrook isn’t exactly the smartest trade options given the Hornets’ current timetable. Therefore, Westbrook to Orlando would likely “make the most sense” for both him and the destination.

    Notice how I haven’t considered Westbrook’s defense so far? That’s because it’s a “scalable” trait, one that’s rarely (if at all) affected by team circumstance. Based on last year’s performance, a rough estimate of Westbrook’s per-game defense impact would be -0.25 points. Based on this and the above analysis, how would Westbrook impact each team’s point differential and how would that translate to postseason hopes?

    • NYK (108.3 ORtg | 112.5 DRtg) -4.2 Net
    • DET (110.5 ORtg | 112.5 DRtg) -2 Net
    • CHA (107.7 ORtg | 113.3 DRtg) -5.6 Net
    • ORL (109.7 ORtg | 109 DRtg) +0.7 Net

    Based on these estimates, Westbrook’s skills would really only be put to use on a team like Orlando, one that appears a desirable fit and one that promises the strongest odds of Playoff success. 


  • Advanced Statistics and Plus/Minus Data

    Advanced Statistics and Plus/Minus Data

    Months ago, I wrote an introductory article on the world of composite metrics, the all-in-one figures that attempt to measure a player’s total contributions in a single number. Today, I’ll expand on the concepts discussed in that post to examine the mathematical and philosophical structures of certain metrics and determine the validity of the sport’s one-number evaluators.

    What makes a good metric? The expected response is likely a mixture of how the leaderboard of the statistic aligns with the viewer’s personal rankings and whether the metric includes non-box data for its defensive component. While this may pick apart some of the sport’s “better” metrics, it won’t separate the “good” from the “great.” The advancements of the game’s one-number metrics are far greater than given credit for, and a player’s situational value on his own team can be captured near-perfectly. It’s the nuances of individual metrics that create poor, good, or great measurements.

    Player Efficiency Rating

    PER was the original “godfather” metric in the NBA, created by The Athletic senior columnist, John Hollinger. PER, according to him, “… sums up all a player’s positive accomplishments, subtracts the negative accomplishments, and returns a per-minute rating of a player’s performance.”[1] Although one of the leading metrics of its time, PER receives strong criticism nowadays for its box-only approach. This may seem unjustified, as metrics like Box Plus/Minus are highly regarded with its box-only calculations. PER differentiates itself from a regression model like BPM in that it’s largely based on theory: expected point values.

    Basketball-Reference‘s mock calculations of PER include a factor called “VOP.” Although the author of the article intentionally leaves it vague, I’ve interpreted this to mean “value of possession.” The resulting factor is an estimate of the average number of points scored per possession in a given season. From there, different counting statistics are weighed to the “expected” degree to which they enhance or diminish the point value of a possession. Due to the large inferencing and supposed values of box score statistics, the descriptive power of PER is limited, and the metric is largely recognized as outdated. However, PER provides an accurate and representative look into the theories and values of the early Data-Ball Era.

    Win Shares

    Basketball-Reference visitors are familiar with Win Shares. Daniel Myers, the developer of the metric, states it “… attempts to divvy up credit for team success to the individuals on the team.” [2] Contrary to most one-number metrics, Win Shares don’t attempt to measure a player’s value on an “average” team, and rather allocate a team’s success among its players. Myers took a page out of Bill James’s book with his Win Shares system, which originally set three “Win Shares” equal to one team win. This meant a team with 42 wins had a roster that accrued roughly 126 “Win Shares.” The ratio was eventually changed to 1:1, so nowadays, a team with 42 wins will have a roster that accumulated roughly 42 Win Shares.

    Myers based his offensive points produced and defensive points allowed on a player-rating system developed by Dean Oliver in his novel, Basketball on Paper. The components, Offensive/Defensive Ratings, are highly-complex box score solutions to determine the number of points added or subtracted on either end of the floor. With these figures for a player, Myers then calculates what’s referred to as “marginal offense/defense,” or the number of points a player accounted for that contributed to winning; ones that weren’t negated in the general scheme of a game. Marginal offense and defense are then divided by the number of points the team required to win a game that season. This creates individual Offensive and Defensive Win Shares measurements as well as total Win Shares.

    The Win Shares system, like PER, was one of the strongest metrics of its time. It was one of the first widespread all-in-one metrics that was able to accurately distribute a team’s success among its players: one of the original holy-grail questions in basketball. The main gripe on the Win Shares system is its use of Oliver’s player ratings, which are widely disdained for not passing the criteria listed earlier: the typical “stat-test.” Oliver’s ratings are, in truth, some of the very best metrics that solely use counting statistics; it’s simply displayed in the wrong format. As Oliver states, his Offensive Rating estimate “… the number of points produced by a player per hundred total individual possessions.” [3] We can substitute “allowed” for “produced” to describe his Defensive Rating. The key words in Oliver’s definition are “total individual possessions.” His ratings measure the number of points produced/allowed every 100 possessions a player is directly involved in.

    Resultantly, Oliver’s ratings are best taken as a percentage of individual possessions, or the number of possessions per 100 in which a player is “directly” involved (assisting, shooting, offensive rebounding, turning over). If a player has an ORtg of 110 with an offensive load of 40, his “adjusted” ORtg would be 44, which represents 44 points produced per 100 team possessions rather than individual possessions. I make this remark to remind us all that metrics can be improved upon, added context to, and revitalized. If Myers were to develop a “Win Shares 5.0,” it may be worth examining to “adjust” Oliver’s playing ratings to a less role-sensitive form. The Win Shares system is notably superior to PER in the comparative applications, with far more descriptive power. It may not rank at the very top of the metric echelons, but Win Shares are a fair and moderately-accurate representation of a player’s value to his own team.

    History of Plus/Minus Data

    PER and Win Shares are two of the most successful and/or widespread metrics that quantify impact with expected values, but this ideology slowly began to disappear. What’s the value of a rebound? How many points of an assisted field goal should be credited to the passer? Is a point even really worth one point? These questions of extremely ambiguous and unanswered natures led statisticians to a new viewpoint on quantifying impact: plus/minus data. This involved measuring a team’s performance with a player on the floor rather than weighing the player’s counting statistics. This new ideology, in theory, is the holy-grail perspective we’d need to perfectly pinpoint a player’s value, but statisticians were once again met with interference.

    Traditional Plus/Minus (abbreviated as +/-) measures the team’s Net Rating, point differential extrapolated to 100 possessions, with a player on the floor. But as the statistically-inclined are familiar with, Plus/Minus (also known as OnCourt +/-) is a deceptive measure of value. Poorer players on great teams that faced poor opponents can have massively inflated scores, while great players on poor teams that faced great competition can have dramatically deflated scores. Resultantly, the application of Plus/Minus was a mostly fruitless beginning for plus/minus data, but that didn’t prevent further advancements. With the main deficiency of Plus/Minus being the lack of teammate and opponent factors, there was a clear path to improving on the ideas of plus/minus data.

    WINVAL, a software developed by Jeff Sagarin and Wayne Winston, drew players’ Plus/Minus scores from all of their possessions to evaluate a given player’s impact on different lineups. The system created the building blocks to commence “Adjusted” Plus/Minus (APM), a statistic that takes a player’s Plus/Minus from all of his possessions and accounts for the strengths of opponents and teammates. Without delving too deep into the mathematical processes, APM is drawn from a system of linear equations that includes the home team’s Net Rating during a given stint (one stretch of possessions in which no substitutions are made) as the response variable, the Plus/Minus scores for players as explanatory variables, and recognition as to whether a given player is on the home or away team or whether they’re in the game or not. This gives the calculator the ability to approximate beta-values that results from the series, that being APM in a given game.

    Squared Statistics

    APM “should” have been the holy-grail statistic the world was looking for. It was clear that assigning expected values to counting statistics would nearly always fail, and this new measurement captures changes in the scoreboard without having to distribute credit across different court actions. But (the trend is becoming more and more apparent here) there were still deficiencies with APM that hindered its descriptive power. Namely, it was very unstable, wavering from year-to-year. Its scores also had massive disparities, with excessive amounts of outliers. Dan Rosenbaum was one of, if not the, first to outline an algorithm for APM, and the top player from 2003 to 2004 was Kevin Garnett (unsurprisingly) at +19.3 (surprisingly). We now know even the greatest players in the most inflated situations are rarely worth +10 points to their team, let alone +20 points.

    Jeremias Engelmann, one of the greatest basketball statisticians ever, created “Regularized” APM (“RAPM”) to reduce these poorer effects, another being multicollinearity. If two or more players spend a lot of their time on the court together, they’ll face equally-good opponents and play with equally-good teammates, and APM wouldn’t know to allocate team credit any differently, even between players with great gaps in talent. The mathematically-inclined are most likely associating Tikhonov regularization, or ridge regression, as the primary method to overturn these effects. A ridge regression essentially removes the effects of multicollinearity and “punishes” outliers, regressing them closer to the mean. This process largely improves the massive errors present in APM and paints a far clearer picture of the impact a player has in a given system. Engelmann not only created the closest statistic to a holy-grail metric we have today but further improved its descriptive power.

    Basketball statistics are often associated and influenced by Bayesian inferencing; namely, the use of priors alongside pure measurements to improve year-to-year accuracy and validity. This could be, for example, blending RAPM with the box score, a traditionally-valued set of counting statistics. Engelmann, however, was credited with partiality to previous data in his “Prior-Informed” RAPM (“PI RAPM“). With three or more seasons under its belt, perhaps even just one, PI RAPM is the best measurement we have a player’s value to his team. It not only includes the philosophical perfections of pure APM, but the mathematical validity of RAPM and the benefits of a player’s past to deliver the most valid impact metric we have today. Engelmann doesn’t update his PI RAPM leaderboard often, having last posted a full leaderboard in 2017 (likely due to focus on another one-number metric), but his contributions to improving APM in the 2000s led way to the revolution we recognize as a heap of impact metrics, each claiming importance among its competitors.

    Regression Models

    With Engelmann PI RAPM either proprietary or deep underground, how can we find precise measurements of a player’s value nowadays? Statisticians around the globe have taken advantage of the linear relationships between certain statistics and a player’s impact on the scoreboard to create regression models that approximate long-term RAPM (rather than short-term due to the aforementioned instability of small samples). The components of each metric are what make them different, but the end-goal remains the same: to approximate a player’s value to his team in net points per 100 possessions.

    Box Plus/Minus

    The most popular regression model, likely because it’s displayed on Basketball-Reference, is Box Plus/Minus (BPM). It’s exactly as it sounds: all explanatory variables are box score statistics. Developed by Daniel Myers, BPM estimates value based on four five-year samples of “Bayesian Era” PI RAPM. This differs from, say, Backpicks‘s BPM, which is based on three-year samples of RAPM. There are multiple technical differences between the two, and the yearly leaderboard exhibit those differences. However, Myers’s model is likely the superior of the two, although we can’t be certain because its counterpart has no records of calculation details. But the defensive component in Myers’s appears far stronger than that of Backpicks‘s, and it’s safe to say the BPM available to the public is the strongest option for box-oriented metrics out there.

    Augmented Plus/Minus

    A less-recognized regression model, but one that makes an argument as one of basketball’s best, is Augmented Plus/Minus (AuPM). Developed by Backpicks founder Ben Taylor, it measures a player’s impact with the box score as well as plus/minus data. The explanatory variables were, described by Taylor, hand-picked, and evidently so. More obvious ones are a player’s traditional Plus/Minus, his On-Off Plus/Minus (team’s Net Rating with a player on the floor versus off the floor), and even Backpicks‘s BPM model, as well as teammate plus/minus data for team context. Then there are more separative variables like defensive rebounds and blocks per 48 minutes. This isn’t to say players with proficiency in defensive rebounding and shot-blocking are automatically more valuable, but as the introductory statistics course sets forth, correlation does not equal causation. AuPM was designed to “mimic” long-term PI RAPM, and the metric likely had greater explanatory abilities with those two statistics in the regression.

    Real Plus/Minus

    The aforementioned “other one-number metric” mentioned earlier, Real Plus/Minus (RPM) is Jerry Engelmann’s enigmatic take on blending the box score with plus/minus data to approximate long-term RAPM. The metric sets itself apart in that there are no real calculation details available to the public. All we know with certainty is that RPM is one more in a pile of box score/plus-minus hybrids. Subjected to the intuitive “third-eye,” RPM may not have the descriptive power of some of its successors on this list, but it’s renowned for its predictive power, fueling ESPN‘s yearly projections. RPM has also not been subjected to long-term retrodiction testing, or predicting one season with the previous season, to compare the predictive abilities of RPM to that of other major metrics. However, two things to consider are: RPM was developed not only by Engelmann but Steve Ilardi, another pioneer of RAPM, and the primary distributor of RPM is ESPN, one of the major sports networks in the world. Given the creators, distributors, and the details we have on RPM, it’s safely denoted as one of the greatest impact metrics available today.

    Player Impact Plus/Minus

    The most prominent “hybrid” metric, Player Impact Plus/Minus (PIPM), is also arguably the best. Provided by Basketball Index, the creation of Jacob Goldstein is based on fifteen years of Engelmann RAPM to approximate a player’s impact with the box score and “luck-adjusted” on-off ratings; those being on-off ratings for a player with adjustments made to external factors like opponent three-point percentages and teammate free-throw percentages: ones the player himself can’t control. The product of this was an extremely strong regression model with an 0.875 coefficient of determination, indicating a very strong predictive power between Goldstein’s explanatory variables and Engelmann RAPM. It’s for this reason that PIPM is recognized as one of, if not the, best impact metrics in the world, especially given the publicity of its regression details. 

    RAPTOR

    The product of the math whizzes at FiveThirtyEight is quite the mouthful: Robust Alogirthm using Player Tracking and On-Off Ratings (RAPTOR). It is, once again, infused with the box score as well as luck-adjusted on-off ratings, but two distinct qualities set it apart. RAPTOR includes player tracking data as a part of its “box” component, with deeper explanatory power as to shot locations, difficulties, and tendencies. The other is RAPTOR’s base regression. While the impact metrics earlier in the list use Engelmann’s RAPM, RAPTOR uses Ryan Davis’s RAPM due to its availability that lines up with access to the NBA’s tracking data. RAPTOR is a very young metric, having been around for only one season, and is based on the least “reliable” response variable, being Davis RAPM in place of Engelmann RAPM (but this is for good reason, as stated earlier). RAPTOR certainly has the potential to improve and grow, as evident from the fluctuation of the metric’s forecasting throughout the bubble, considering its great pool of explanatory variables. I wouldn’t bet on the best of RAPTOR as having been seen just yet.

    Player-Tracking Plus/Minus

    Player-Tracking Plus/Minus (PT-PM) is one of the less recognized impact metrics, but certainly one of the most intriguing. It’s exactly as it sounds: calculated from (box and) player tracking data. The metric was created by Andrew Johnson in 2014, a time when SportsVU was the primary provider of tracking data for the NBA. Since then, Second Spectrum has taken over, but it shouldn’t cause any deficiencies to calculate PT-PM in the following seasons. Tracking data that made its way into the regression included “Passing Efficiency” (points created from passing per pass), turnovers per 100 touches, and contested rebounding percentages. The defensive component was more parsimonious, requiring fewer explanatory variables for great descriptive power: steals per 100 and opponent efficiency and the frequency at the rim. These public variables were taken from the beta version of the metric, but the results were very promising. There’s limited information on PT-PM in the last few seasons, but its replication would likely produce another great family of impact metrics.

    So why take the time to invest in impact metrics to evaluate players? For one, they capture a lot of the information the human eye doesn’t, and they do it well. The philosophical premise of metrics like RAPM and its role as a base regression makes the large heap of impact metrics extremely valid, not only in principle but in practice. If we operate under a series of presumptions: a player is rostered to improve his team’s success, and teams succeed by accruing wins, and games are won by outscoring an opponent, then the “best” players have the greatest impacts on their teams’ point differentials. Now, there will always be limitations with impact metrics: they only capture a player’s value in a role-sensitive, team-sensitive context. If a player were to be traded midseason, his scores would fluctuate more than they would if he remained on the previous squad. But adding context to impact metrics through practices like film studies and partiality to more helpful information (like play-by-play data), we can draw the most accurate conclusions as to how players would perform in different environments. 


  • Joel Embiid | 2020 Valuation

    Joel Embiid | 2020 Valuation

    (? The Ringer)

    Four years ago, Joel Embiid was on the verge of being labeled a lost cause. Taken with the third overall pick, a prodigy from the prestigious basketball academies of Montverde Academy and the University of Kansas, he missed what would’ve been the first two full seasons of his career with foot injuries. Nowadays, that’s ubiquitously known as a non-issue, seeing as Embiid is in a deadlocked duel for the title as the league’s top center. Do his strong offense and DPOY-potential defense vault him high enough to claim the spot? And what are the percent odds Embiid gives a random team to win a title?

    Scoring

    Joel Embiid quietly remains one of the league’s top scorers. His standard profile of 23.0 points per game and 59.0 TS% don’t pop out as much as Embiid’s true scoring equity does. Due to a mere 29.5 minutes per game and Philadelphia’s -1.3 relative Pace, Embiid was actually closer to a 28 points per game scorer; during the regular season, he averaged 28.4 points per 75 possessions on +2.5 rTS%. In the Playoffs, those numbers expanded to 31.9 points per 75 on +3.9 rTS%. It’s worth noting Boston’s lack of strong interior defenders in that series, but Embiid’s scoring performances were signs of potential superstardom in the postseason.

    PBPStats

    Embiid’s shot chart dots the efficiency, frequency, and locations of his shooting spots from this year’s Playoffs. Evidently, his relatively broad points of attack suggest Embiid’s monster scoring in the second season wasn’t merely a result of facing poorer paint defenders. Furthermore, Boston’s strong regular-season defense (-3.6 rDRtg), given Embiid’s shot locations, was likely to limit some of his efficiency and volume, neither of which eventually were. His strong post-game was increasingly strong against the 6’8″, 245-lbs Daniel Theis as well. Embiid went to the free-throw line at an insane rate in that series, posting 15.4 free-throw attempts per 75 and 7.97 free-throw attempts per field-goal attempt. Embiid displayed strong tendencies to draw fouls in the regular season, but took it to a whole new level in the Playoffs.

    It’s no secret that Philadelphia’s star center is less proficient at generating offense outside of the post. Embiid often takes ill-advised fadeaways outside of the painted, a surprising note given his converted on an adequate 41% of mid-range attempts in the regular season. He’s also prone to miss driving lanes, eliminating key opportunities for easy baskets. However, in high-effort stints, Embiid isn’t the lethargic, heavy-footed big man he appears to be at first glance. His balance, considering his size, is an indicator of strong momentum shifting.

    Playmaking

    Embiid’s passing is nothing to marvel over. He seldom shows flashes of proficiency in this facet in the post in which he’ll occasionally make an efficient, well-placed pass to an open interior scorer. However, he’s also prone to misreading handoff opportunities, and with screening action as a focal point of Embiid’s offense, it’s reasonable to suggest his passing hurts Philadelphia more than it helps. Embiid’s Passer Rating, a numerical estimate of passing quality, was in the 34th percentile in 2020. It’s also estimated he’s a negative-impact playmaker, contributing fewer than zero points per 100 in that manner. There are some positive indicators of Embiid’s creation. He opened more than six extra shot opportunities for his teammates every 100 possessions in the regular season; however, it’s also a figure that dipped over three points in the Playoffs. It’s unlikely Embiid will ever strengthen a good offense with his playmaking abilities.

    Off-Ball

    During the possessions in which Embiid isn’t “meaningfully” involved in the 76ers’ offense (~ 55% of possessions), he provides solid off-ball value. As his role as big man implies, a large part of Embiid’s off-ball repertoire is screening action up top. He’s a “dual-threat” screeners in this manner, displaying proficiency in both the interior and on the perimeter. Embiid is a strong pick-and-roll screener with a solid regime running with teammate Ben Simmons. However, Embiid’s off-ball specialty lies closer to the glass. He’s one of the game prominent offensive rebounders, grabbing 10.3% of available opportunities and 3.4 per 75 possessions. It isn’t merely a product of his 7-foot, 280-lbs frame either; Embiid is extremely active on the offensive glass. It’s arguably his strongest point of engagement and one of the areas Embiid thrives in. He’s prone to the occasional flop, wildly exaggerating contact near the basket, but his off-ball value is enough to keep afloat as an interior-specialist center. These qualities wouldn’t fit especially well alongside strong teammates.

    Offensive Summary

    Impact metrics are fairly split on Embiid’s offense. Play-by-play-infused metrics clearly grant the lower end of the stick in terms of offensive impact. For example, Basketball Index‘s PIPM and FiveThirtyEight‘s RAPTOR both denote Embiid’s offense as worth less than 1.1 net points per 100 possessions. However, these results are likely due to some extremities. Philadelphia’s offense improved by +2.6 points per 100 with Embiid off the floor, skewing some of these results. Box score estimates paint a fairer picture of his offense. Basketball-Reference‘s Box Plus/Minus measures Embiid’s offense at +3.7 while my own Box Plus/Minus model estimates that value at +3.4 in the regular season and the Playoffs. Embiid is not an offensive superstar, but his strong scoring is enough to propel him near the top of the pack in the major impact metrics.

    Defense

    Despite a high defensive valuation for Embiid, I’m fairly critical of his team defense. At times, he’s too post-oriented, opting to leave strong perimeter threats open without a paint presence to justify. Although Embiid has that strong frame that we examined earlier, he doesn’t always stay in front of his matchups. He also falls back too immensely on strong-shooting matchups, leaving several open floaters. There are also questions on his focus. Embiid seldom ball-watches, loses players who don’t have the basketball in their hands, and lacks the general defensive attentiveness to maintain consistent off-ball value.

    Conversely, the qualities that make Embiid one of the league’s premier defenders are also apparent. He shows strong passing anticipation; and although he isn’t the strongest and jumping and clogging passing lanes, his reaction time counterbalances some of his slower movements. Embiid is one of the strongest paint presences in the league, having blocked 3.7% of available two-pointers in the regular season and 3.2% in the Playoffs. Paired with a sturdy stature and strong vertical movement, Embiid is one of basketball’s most dominating post defenders. Despite this paint-exclusiveness, Embiid’s value in the Playoffs remains relatively similar. Research done through Thinking Basketball suggests interior-oriented defenders lose large amounts of value in the Playoffs, while Embiid retained nearly all of his (2.3 D-PIPM in the Playoffs).

    Defensive Summary

    Impact metrics regularly view Embiid as one of the game’s strongest overall defenders. Box score estimates are less sensitive to his value due to a declining block rate and a stagnant steal rate; Basketball-Reference estimates his per-100 defensive impact at +1.0, Backpicks argues it’s barely over half a point, and Cryptbeam DBPM clocks that figure in at +1.4. Conversely, plus/minus hybrids value Embiid’s defense significantly higher. His three-year LA-DRAPM is a tick under +5, a clear overstatement compared to his scores in D-RAPTOR (+3.6), D-PIPM (+2.29), and DRPM (+2.00). Embiid’s post tendencies lead me to believe his defensive impact is inflated in pure impact measurements (RAPM), which is still good enough to denote Embiid as a strong All-Defensive level player.

    CPA Valuation

    Joel Embiid would provide a random team an increment of approximately 12.11% odds to win a championship. 


  • A Statistical Guide to 3-Point Proficiency

    A Statistical Guide to 3-Point Proficiency

    (? The Ringer)

    Tony Bradley, Drew Eubanks, and Johnathan Motley. What do these three players have in common? They each made 100% of their three-point attempts last season. Therefore, they must be the league’s best three-point shooters, right? No, of course not. Although the word “best” can have varying connotations here, it’s hardly appropriate to say three players who shot no more than 1.2 threes every 100 possessions were the best three-point shooters of the year. It’s been clear for a long time that conventional three-point percentage is, in essence, not a perfectly-indicative measurement. It pays no attention to the frequency at which a player shoots three-pointers. This has been combated with mental filtering for a while now, but what if there were a method to balance efficiency and volume in three-point shooting and condensed into one number?

    Patrick Miller at Nylon Calculus tried to answer this question, specifically for college basketball players, to predict their three-point percentages in the NBA. His “Bayesian 3P%” was a success, appropriately pinpointing the three-point proficiency of college stars while providing accurate estimations of NBA percentages. Millers’ strong methodology and strong results had me thinking about the applications of Bayesian statistics in the NBA, and how they could improve the traditional measurement of three-point percentage, the result being a “prior-informed” three-point percentage or PI 3P%.

    Methodology

    As stated earlier, the goal of PI 3P% was to find a balance between efficiency and volume from beyond the arc to create an “adjusted” three-point percentage that accounts for a player’s shooting volume from that range. I retained the essence of Bayesian statistics in PI 3P% with the use of priors: previous beliefs on a subject used to improve the raw data, ours being three-point percentage. To do this, I regressed (logarithmically) the last twenty-five seasons of three-point attempts onto three-point percentage to provide a foundation for the prior; thus, accounting for diminishing returns on higher frequencies under the impression that three-point percentage becomes more and more indicative as a player takes more and more shots. All data in the regression were adjusted to “per-100.”

    With the prior, I was able to estimate a player’s three-point percentage based on how often he shot from that range. The next step was to merge a player’s actual percentage with his expected percentage, but I also had to decide to how great a degree the latter would be weighed. This process was simply a lengthy test of observing how percentages change with different weightings and comparing residuals against three-point attempts. If the weighting was a success, then the residuals should decrease as attempts increase (below). 

    From a sample of last year’s data, we can see there’s a typical decrease in adjustments as a player’s frequency from three-point range increases. The prior serves the purpose of negating extremely-high percentages on low volume but also reduces the effects of anomalous results. Dusty Hannahs of the Memphis Grizzlies converted on 67% of his 10.8 three-point attempts per 100 possessions, a mark that lowers to a 46% prior-informed three-point percentage. This is an extreme instance, of course. Players’ updated three-point percentages will continue to represent great-shooting seasons with minor luck adjustments. That being said, adjusting for luck does not extend to playing time. Hannahs, the league’s leader in prior-informed 3P% last year, played a mere 13 minutes the entire year. PI 3P% is a descriptive statistic to measure a player’s three-point proficiency during his time on the court. 

    With our prior-informed 3P% up and running, can we still reasonably state the original trio of Tony Bradley, Drew Eubanks, and Johnathan Motley represents the league’s best distance shooters? This model strongly disagrees, with no player of the group posting a new percentage higher than 28%. Instead, we can select a new group of players in place of them. For players who were on the court for at least 1500 minutes last season, the top shooters in PI 3P% are:

    1. Duncan Robinson
    2. J.J. Redick
    3. Dāvis Bertāns
    4. Buddy Hield
    5. Seth Curry

    This group is far more representative of the league’s top distance scorers, each of them having shot at least 9.8 attempts per 100 with an efficiency of at least 39%. Meanwhile, Tony Bradley, the sole member of our original trio to make the Playoffs, fell to 0% in the second season. With a prior-informed three-point percentage, we can reduce the need for mental filtering in determining the league’s best three-point shooters.

    The database for PI 3P% can be found here.


  • Jrue Holiday | 2020 Valuation

    Jrue Holiday | 2020 Valuation

    (? The Ringer)

    Is it fair to say New Orleans’s Jrue Holiday is underrated at this point? He’s had several instances of strong recognition in his career, including an All-Star appearance and two All-Defensive Teams, as well as praise following his twenty points per game season last year and a great display of defense against Damian Lillard in the 2018 Playoffs. However, question marks have been raised about the validity of his impact. Holiday’s luck-adjusted RAPM in the last three years has been higher than all but one player in the NBA. The dichotomy of his lesser forms of recognition versus supposed impact led me to set out to answer an important question surrounding his true value: what are the percent odds Jrue Holiday provides a random team to win a title?

    Scoring

    Holiday’s scoring is one of the strongest indicators of his role: the offensive engine of a moderate offense. Although he plays the shooting guard position, Holiday acts like a point guard in the Pelicans’ offense. He’ll often receive the rock at the perimeter, specializing in either the wings or up top. Holiday typically attacks the basket with very slow drives. He sizes up the defense instead of immediately penetrating to the rim, and this action spurs ball movement on the perimeter and improves New Orleans’s playmaking, as we’ll examine later on. Holiday is exempt from his less pressurized drives by his agility near the hoop. He’s neither particularly explosive nor quick, but his ability to maneuver his hips and sides creates several shots in the paint. However, Holiday converts on a mere 59% of attempts at the rim with his lowest efficiency from within three feet of the rim in three years.

    Particularly unique to him in a group of elite NBA players, Holiday rapidly declined in scoring efficiency from last season. He surged in the category from the 2017 to 2018 seasons, posting a +1.4 rTS%, a +3.5% increment from the previous season. The season afterward, Holiday was just below league-average at -0.2%. During 2020, that figure dropped to -2.4%. What created this mostly unforeseen deterioration in scoring efficiency? If we look at his shooting locations in each of the past two seasons, a clear trend emerges that may explain some of Holiday’s shooting deficiencies.

    2018-19 season

    2019-20 season

    Provided by PBPStats, there are two clear distinctions between the two charts: Holiday’s lack of efficiency in the paint and mid-range attempts in the 2020 season. Perhaps there is a “poor-luck” nature to his woes in the post; Holiday’s efficiency from within three feet of the hoop is the lowest it’s been in the last three seasons. However, considering Holiday’s efficiency in that range this year would surpass each of his marks from his first eight seasons, it’s safer to refrain from a “poor-luck” perspective. Rather, it’s more likely Holiday’s efficiency is stabilizing after two anomalous seasons in the paint. Due to his subpar efficiency and volume that doesn’t compensate for the missed opportunities for his shots, I wouldn’t recognize Holiday as a “good” scorer in the NBA, but his attributes in this facet contribute toward a larger range of team offense.

    Playmaking

    Holiday’s ability to engineer an offensive is done through his creation and passing rather than his scoring. His aforementioned tendency to start with slow drives toward the paint often spurs the action of the Pelicans’ offense. When Holiday positions himself near an elbow, just outside the paint, his presence is enough to draw defenders from the perimeter inward, as if the middle of the paint is the center of a gravitational force acting against opposing defenders. Holiday’s creation is largely due to his ability to unclog the corners, two spots at which New Orleans frequently positions shooters to take advantage of Holiday’s strengths. His constant ability to carry out this series of events makes up a large portion of his offensive value and points toward his contributions as a creator.

    Although he’s not the highest-quality passer in the world, Holiday is still capable of hitting tougher spots in pressurized situations. New Orleans’s passing on the perimeter is among the league’s best, and Holiday’s creation is the initial force behind it. If it weren’t for Holiday’s selective creation, his offensive value would be far lesser. It was enough to grant him a Passer Rating upward of seven on the one-to-ten scale, continuing his statistical trend of high-quality passing. Holiday’s playmaking was worth almost three-quarters of a point per 100 according to Backpicks‘s “PlayVal,” but I think that measurement undermines his capabilities as an offensive funnel through his creation and passing. Due to Holiday’s declogging and perimeter action, I’d denote him as a “very good” playmaker in 2020.

    Off-Ball

    Holiday’s value off the ball is almost exclusive to the perimeter. Given his role as more of a point guard to the Pelicans, he’s frequently required up top to initiate facilitation or score in the post. Resultantly, it’s uncommon to see a consistent string of possessions in which Holiday makes a significant impression in the paint without the rock in his hands. Although his preference of the arc may seem a deficiency at first glance, Holiday provides a number of positives on this front. Despite his 6’3″, 205-pound frame, he’s an effective screener on the perimeter, and similarly a proficient pick-and-roll screener. Holiday plays an extremely active role up top. During conservation situations, he’ll plant himself at a corner, a schematic New Orleans’s offense displayed throughout the season. Holiday’s adequacy as a shooter (35.3% from 3) makes him a great option for the Pelicans in these spots. He may not provide the distinct value of a Stephen Curry or Reggie Miller, but Holiday’s off-ball value is of use to a multitude of offenses.

    Defense

    Holiday’s case as one of the league’s top guards relies on his defense. He plays a low-risk style of defense that minimizes errors. Holiday’s most frequent mishaps, missing deep cutters and flat-footedness in transition plays, are very rare occurrences on the court. His far more prevalent strengths are prominent either on or off the ball. When he’s directly guarding a matchup, Holiday has some of the strongest positionings of any guard in the league. His strong mix of upward and downward stances to match the angle of his opponents cause some of the strongest commotions a 6’3″ guard could do. Holiday consistently staggers offensive sets, denying penetration attempts additionally with his great hands. This is largely in part due to an optimized armlength radius, keeping opponents far enough at bay to prevent foul trouble but close enough to prevent easy drives. As evident from his 1.7 steals per 75 possessions, his pickpocketing capabilities are near the top of the league. Paired with strong defensive coverage, especially on the perimeter and in recovery, Holiday is one of the very best defensive guards in the NBA today.

    Summary

    Impact metrics have a large variance but a stable typical picture of Holiday’s value. His aforementioned luck-adjusted RAPM was second in the entire league. Holiday’s minimum comes from Goldstein’s PIPM at +1.73 per 100 possessions. With an offensive impact typically ranging from 1.5 to 2 points and a defensive impact usually worth 0.5 to 1 point per 100, Holiday’s situational value is mostly stable aside from his RAPM-esque outliers. Play-by-play data certainly paints a greater picture of his value than the box score, and pure situational value argues he’s among the league’s best. However, due to his declining RAPM (+1.4 in 2020), it’s likely a three-year sample is too partial to earlier events. Based on evaluations of Holiday’s offensive and defensive values, I’d denote him as an “All-Star level” player in 2020 and estimate Jrue Holiday provides a random team with 7.7% odds to win a title at full health. 


  • Jamal Murray | 2020 Valuation

    Jamal Murray | 2020 Valuation

    (? The Ringer)

    Jamal Murray was already showing strong signs of improvement coming into the bubble. He’d taken on an increased load, with notable increments in usage rate and offensive load. More importantly, Murray had started doing more in his time on the court. However, the Playoffs painted a new, renowned picture of Murray’s potential. He exploded in the postseason, with drastic improvements in scoring volume, efficiency, creation, and offensive rebounding. Murray’s stellar performance in the second season left questions as to whether the stint was merely a fluke or an indicator of seasons to come. I’ll attempt to provide an answer to the questions surrounding Murray’s game and determine the overarching principle of my player valuations: what are the percent odds Jamal Murray provides a random team to win a title?

    Scoring

    Murray’s scoring is largely built around his role as an on-ball driver. For the first time in his career, his usage rate exceeded 25% and his offensive load has exceeded 40%. Murray functions well up top as Denver’s primary pick-and-roll ball-handler, a tandem he enacts with teammate Nikola Jokić as one of the most effective routines in the team’s offense. Murray will use these opportunities to search for shot opportunities at the perimeter or in the mid-range. His highly-effective step-back move is one of the driving points of his superb mid-range scoring; Murray converted on 46% of his 7.4 attempts per 75 from that range. In the Playoffs, he continued this strength and used it to punish the Lakers’ strong defense. Murray improved from every single one of Basketball-Reference‘s primary shooting ranges from the previous season, an indicator of his growing efficiency.

    Interestingly, Murray has had an up-and-down track record with scoring efficiency. His True Shooting percentage has been below league-average in three of his four seasons, with the exception in his sophomore year: a product of improved efficiency from two and three-point ranges. In 2020, that mark was a -1.1 rTS%. Murray was the most efficient from inside the arc as he’d been in his career, but subpar distance shooting (34.6% from 3) saw a dip in overall efficiency. However, Murray’s efficiency took an unprecedented leap in the Playoffs, coming in at +6.7% greater than league-average, despite facing three tough defenses in the Clippers, Jazz, and Lakers. If we examine Murray’s shot charts from the regular and postseasons, there are identifiable trends.

    Regular Season

    Playoffs

    Provided by PBPStats, we can see the diversity of Murray’s shot locations decreased from the regular season to the postseason. It can either be attributed to 1) fewer opportunities to expand his locations or 2) a higher dependency on the two most efficient ranges: the perimeter and the paint. There’s a clear decrease in mid-range frequency, especially near the corners. Murray’s mid-range proficiency allowed for less hesitance closer to the free-throw line, but his heavier reliance from three (where he shot 45%) and the rim (where he shot 66%) created drastic changes in his efficiency and volume. For reference, Murray had a ScoreVal (an estimate of points per 100 from scoring) below zero. In the Playoffs, that figure nearly reached 1.5 points, the tenth-highest score in the second season. Murray’s regular-season volume and postseason scoring will likely propel him to All-Star status, but his regular-season efficiency will play a large role in the future of his career. My recommendation: prioritize the ranges he excelled in during the Playoffs, the paint and the perimeter, and cut down on mid-rangers near the corners.

    Playmaking

    Murray is also one of the league’s better passers and playmakers. During the regular season, he showed promising results on that end with solid transition play and the ability to open up the corners: two prominent spurs of Denver’s offense. The only true knock against Murray’s regular-season passing was a slight lack of recognition in certain plays. There were spots in which he was positioned to split the defense with a bounce pass to a roller, yet Murray would refrain. All things considered, he was a very good playmaker in the regular season, creating around eight shots for teammates every 100 possessions with a Passer Rating eclipsing the six-mark. Murray’s postseason playmaking, however, reached an elite level. Although his Passer Rating was identical to his regular-season mark, the figure doesn’t do justice to how good Murray’s passing was in the second season. This more engaged version of Murray was a near-elite playmaker, creating upward of twelve extra shots every 100 and converting on extremely difficult attempts.

    His regular-season playmaking was summed up in his PlayVal, an estimate of points added per 100 from playmaking, which came it over half a point. Already a good mark for Murray, similar to his scoring, his postseason playmaking became elite. Instead, he was contributing nearly 1.5 points every 100, which, similar to his Playoff ScoreVal, was one of the best scores in the entire league. Here, an old question arises: was this postseason jump a fluke? I’d hesitate to say it was; Murray’s passing was certainly better, but it seemed more a product of engagement rather than a lucky burst. His creation doesn’t receive the exact same treatment; some of his proficiency was aided by strong scoring, which is more likely a product of luck. However, it isn’t unreasonable to state Murray is a good, or even very good, playmaker in 2020.

    Off-Ball

    Similar to the league’s group of on-ball guards, Murray doesn’t provide a whole lot of value without the ball in his hands. This isn’t to say he goes so far as to idle on the perimeter like James Harden. Rather, Murray anticipates regaining the ball in these spots. He’ll often run the ball down the court, after which he’ll snap a quick pass to a teammate on the perimeter and come down near a corner. If Murray doesn’t try any screening action to open a teammate up near the top of the perimeter, he’ll often run a back-and-forth route back up top to get the rock. Murray targets potential screeners on the perimeter for handoffs and a quick path to attack the basket. He’ll rarely find himself camping out in the post, but an elbow isn’t uncommon. These deeper plantings allow for teammates to screen against Murray’s defender, open up Murray, and get him back up top to run some more offensive action. Denver has a great system built around Murray’s lack of elite off-ball value, allowing him to emphasize his strengths and contribute the most he can to the scoreboard when the ball isn’t in his hands.

    Defense

    Murray is a 6’4″ guard with a 6’6″ wingspan, so without the face value physical traits, his defense would come across as underwhelming. However, the value he brings on the defensive end doesn’t seem to hurt Denver’s defense at all; in fact, it may even help slightly. Murray’s defense has minorly fluctuated over the length of the season, but the aggregate of all his efforts paints a good picture of his defensive capabilities. For example, he shows good hands and hand placement, often finding smart steals opportunities in slowed fastbreak plays. Murray stole the ball 1.3 times every 75 possessions in the regular season. He also has surprisingly strong positioning. Against strong centers like Joel Embiid, Murray was able to keep his matchups in front with planted feet and an upright stance. He’s also a good switch defender, making more automatic rotations than a typical guard. Murray recognizes the need for perimeter coverage as well, and doesn’t fall under the typical umbrella of guards leaving at least one perimeter threat open. I’d argue Murray is a neutral-impact defender in 2020.

    Summary

    Impact metrics are fairly indicative of Murray’s true value. His offense is typically valued at around two net points per 100 in the regular season, and even higher in the Playoffs. I wouldn’t argue with these scores too much, although Murray’s role as an on-ball talent leads me to believe he wouldn’t experience lesser diminishing returns alongside greater teammates. His defensive scores are also relatively stable. It’s mostly evaluated as neutral in impact, with anomalous scores from metrics like RPM (+1.31 DRPM). It’s worth noting RPM grants Murray a score of -0.39 on offense, without a doubt a large question mark. However, his impact is appropriately represented through impact metrics. I’d estimate Jamal Murray provides a random team with 6.86% odds to win a title at full health.