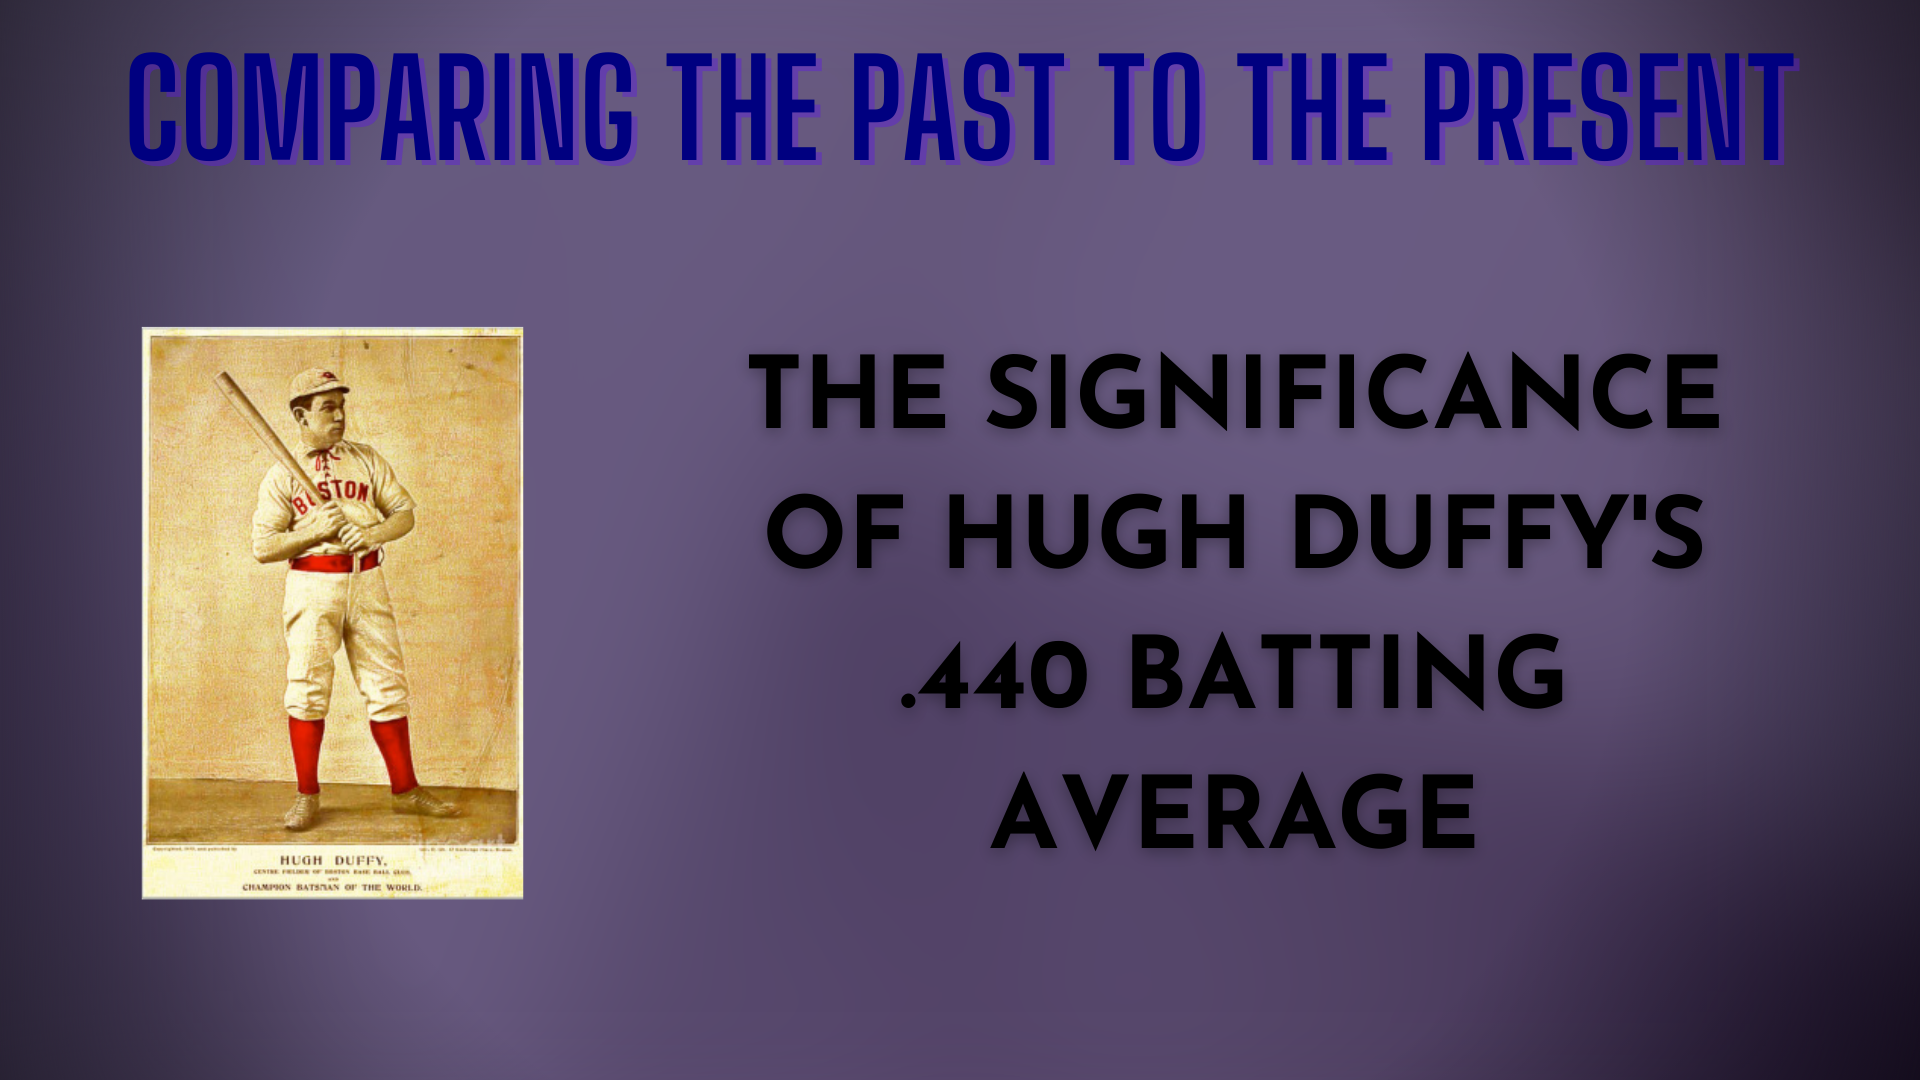
During the 1894 MLB season, Hugh Duffy of the Boston Beaneaters set a new precedent for contact hitters, posting an outstanding .440 batting average. This record has yet to be broken and will likely never be. Naturally, this sets forth the idea of questioning how valuable Duffy’s average truly was. What would a .440 hitter in 1984 have looked like if he played at the same level during, say, 2020? Here, I’ll use a technique to prorate Duffy’s batting average to an environment closer to the one batters play in today as an introductory example to accounting for stat inflation in the MLB, as well as to gain some more insight as to how impressive Duffy’s 1894 campaign really was.
The Method
To standardize batting average across eras, we need to set a baseline for the hitting environment. Because we’re adjusting stats closest to the 2020 season, I’ll choose values that are very similar to today’s to allow for more intelligible comparison. Last season, the MLB’s cumulative batting average was .245, a mere half-percent less than the “conventional average” of .250, so for these standardized values, we’ll set the typical batting average as such. The next point of consideration is the dispersion of our ideal batting averages, which will be measured with a conceived standard deviation. There are two options for us here:
- Measure the standard deviation using all players with at least one at-bat.
- Measure the standard deviation using all qualified hitters ( 3.1+ plate appearances per team game).
It may seem there wouldn’t be a significant change, but in taking one of the other, the standard deviation will vary by roughly 10%. For example, in 2019, the standard deviation of batting average using the first method would draw a value of roughly 13.5%. The second method garners a typical variance of 2.6%. Because the distribution of batting average looks approximately normal, I’m inclined to use the second method. It also makes sense to think a “good” hitter (one standard deviation above the mean) would hit roughly .280, a “great” one would hit about .310, and a .340 hitter would be in contention for the batting title. Thus, we’ll set the parameters of our standardized batting curve to a mean of .250 and a standard deviation of 3%.
There was also one more variable that I suspected would play a role in a fair cross-era comparison. (This is concerning cumulative stats such as hits or home runs). League offenses were far more efficient on a per-game basis in 1894 (7.38 runs per game) than in 2020 (4.65 runs per game). This could potentially mean a quicker flow of offense during 1894 granted its players far more opportunities per game than in 2020. Thus, I calculated a figure I’ll call “pace,” the number of plate appearances every nine innings. (I chose to use nine innings rather than one game because per-game stats will be affected by extra-inning games.) During the 1894 season, there were about 43.0 plate appearances every nine innings whereas, in 2020, there were 39.8. This may not seem to be a significant factor, but it could be the difference between four and five plate appearances in a game for the cleanup hitter.
Duffy’s New Average
During the 1894 season, the “placeholder” standard deviation was absurdly high compared to its 2020 counterpart, making Duffy’s .440 batting average less impressive on our standardized scale. By taking the z-score of his batting average, we obtain a value of +3.825, which on the standardized scale, is…
*drum roll please*
… a new average of .365! This means that if Duffy were to have played at the same level in a roughly 2020-esque environment, just under 36.5% of his at-bats would have resulted in a hit. This is still a very impressive feat, and Duffy would still claim the batting title among the 2020 contenders, but his hitting proficiency is closer to that of DJ LeMahieu last season (.364 average) than an outlier among outliers in MLB history.
Significance
It’s often well-known that batting averages in baseball will fluctuate over time, explaining why the superstars of the late 19th and early 20th centuries will post some averages greater than .400 while the very best of today will rarely exceed .350. However. there have been few attempts (that I’ve seen) to adjust for these changes to create a “Standardized Scale.” (From here on out, I will refer to these adjusted baseball statistics with a “z” abbreviation (alluding to the notation of the standardized test statistic)). So Duffy’s 1894 batting average of .440 correlates to a “z” BA of .365. My goal with these values is to help evaluate MLB players of the past in fair comparison to players of the present, to shed more light on the true capabilities of the greatest baseball players of all time.

Leave a Reply